The Fed has been encouraged by the barrage of weakening economic news, and so once again investors have found that to be a green light to be bullish, and that optimism sent the market to fresh highs, right before the market closed for the U.S. holiday. While bad economic news may mean bad news for the market one day, that time isn’t yet, but it may be sooner than you think. I’ll show you some charts that you need to know now.
Let’s first review the Weekly Jobless Claims report, showing that jobs are more difficult to come by as the 4-week moving average crept higher to 238.5k, up from 236k.

Let’s not ignore June’s sharply lower-than-expected services sector activity, which experienced its worst contraction since May 2020. Ouch!

Fed Chair Jerome Powell said the jobs market has become more balanced, reiterating a strong, but cooling job market. That led him to say there has been quite a bit of progress on inflation and the disinflation trend shows signs of resuming.
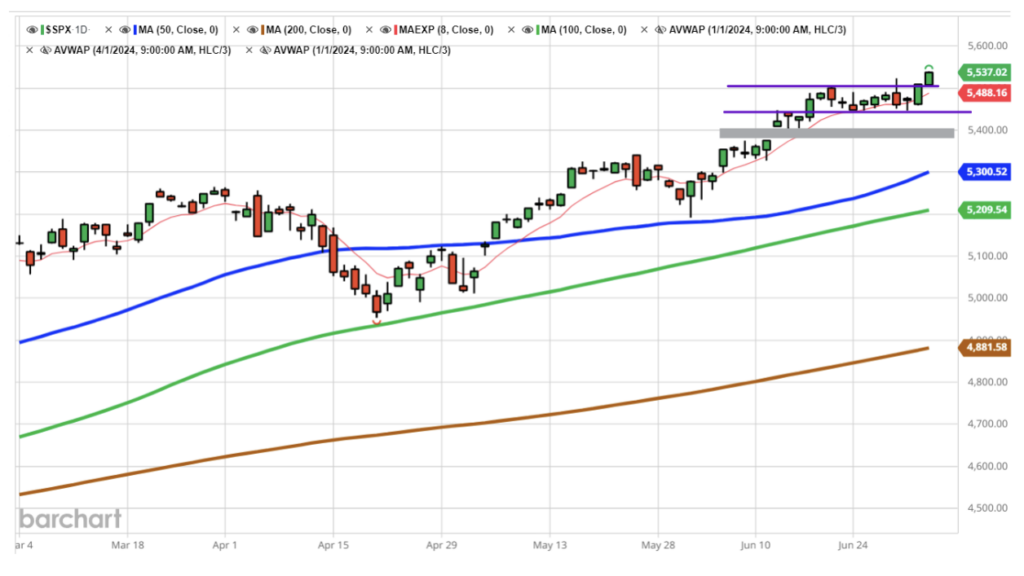
After an initial gap in the S&P 500 (SPX) in mid-June, many predicted the market would fill that gap before moving higher. As such, for about two weeks, the bulls and bears fought over which direction the market would go. With earnings season fading and no direction from the Fed, the market oscillated in a narrow trading range.

With economic reports showing weaknesses across the board, the market pushed higher on the optimism of future rate cuts.
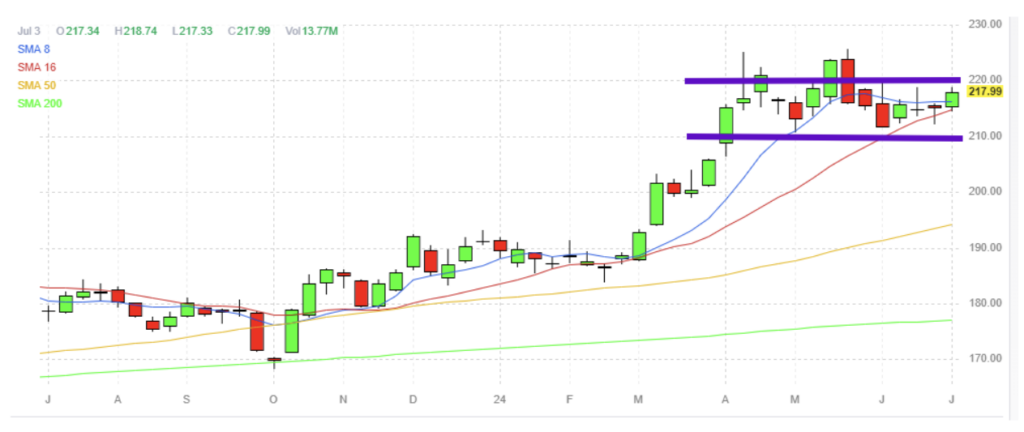
Gold (GLD) has also been in a tight trading range and while Gold can sometimes be used as a hedge against a dropping market, it can also track the broader market. Investors who are shaky about weak economic reports are rushing into Gold, and pushing it higher as well.

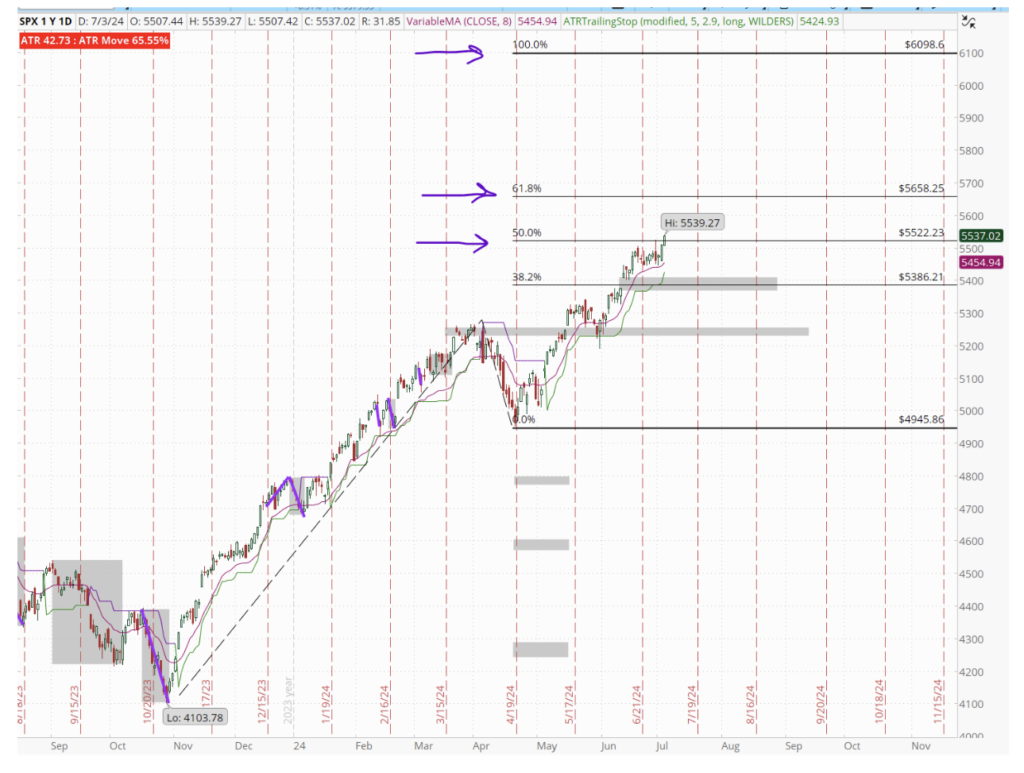
The question is, will this bullishness continue? Well, if we zoom out some and go back to when this wave started at the end of October 2023, the first real pullback we had was in April, and we’re in another impulse moving higher. I’d target $5658 as your next area of interest. Of course, one day above $5522 doesn’t mean we’re moving higher, but it’s nice to see a pop higher after a consolidation period. In other words, the market had a chance to rest before making its next move higher up the mountain. In the shorter term, watch for a potential area of resistance around $5585.

If things are so great now, when will the bad economic news be bad for the stock market? When will the next dip happen?
Historically speaking, July has been a strong month going back over the last 5 and 10 years. We have another round of earnings coming and the optimism helps boost returns while CEOs can beat their lower-revised estimates from last quarter. I don’t expect to see that change this year.
However, August and September are different stories, typically trading lower. With the uncertainty of the U.S. Presidential election looming (nothing to say of the mental capacity of either candidate – but really? Is this the best America, a superpower, has to offer?), I suspect volatility will spike and we could see a bumpier ride in the next couple of months.
The other chart making the rounds comes from the Federal Reserve Bank showing the S&P 500 returns after being adjusted for inflation. While the markets are posting all-time high numbers, the reality is that we’re just about where we were in 2021.

So while there’s a lot of hype around artificial intelligence and the next technological cycle, we’re no better than 2021. Maybe that’s why future earnings estimates are higher than the 5-year historical average. Maybe the multiple needs to be adjusted for inflation.
While the market lifts higher on optimism, the reality is the U.S. economy is losing momentum and that’s a bigger risk that we could see come back around at the end of July.
But the celebration of Canada Day and Independence Day is all about hope and optimism for the future while reflecting on what it took to get where we are now. So, I suppose it’s fitting to see the market bring out the fireworks this week.
Enjoy the weekend. See you next week!


