
It seems like for months we’ve been focused on reports like the Consumer Price Index, Producer Price Index, and Gross Domestic Product growth. Everything had to line up perfectly to give us the soft landing, and for weeks, we were hoping to see a slowdown in growth just enough to give the Fed reason to cut interest rates. Now investors are getting that slowdown they asked for, but the stock market is falling instead. What can stop the fall and where can the market head from here?
Let’s start looking at the broader picture for September, using Seasonality – the tendency for stock prices to exhibit consistent patterns at certain times of the year.
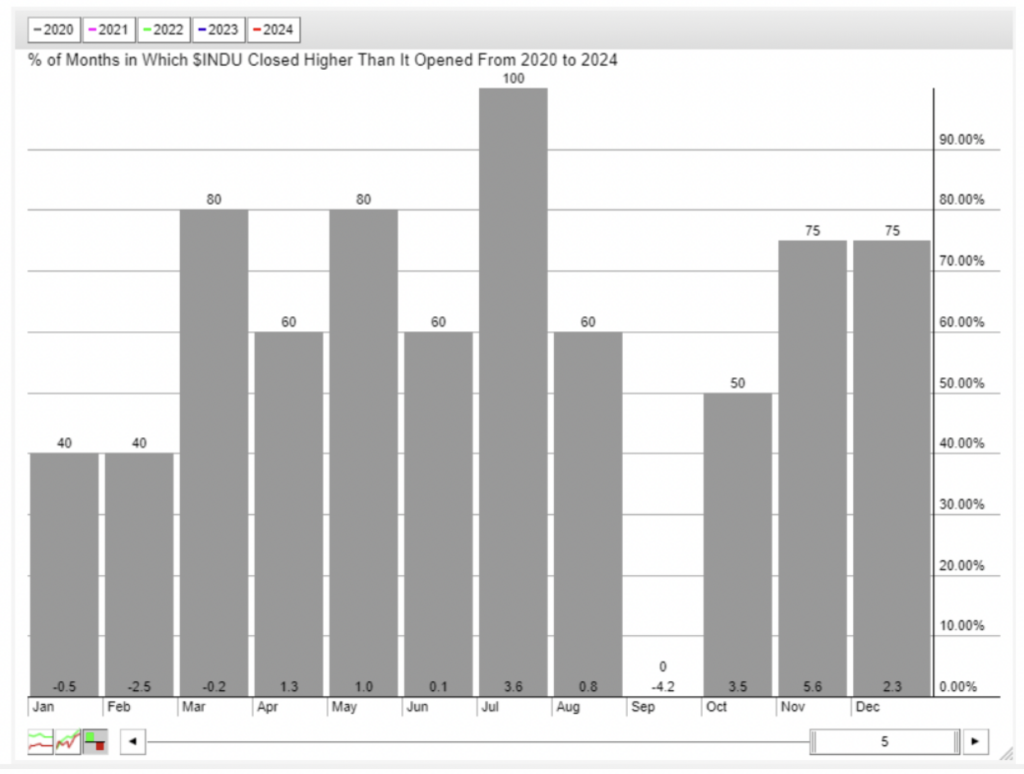
Here’s the monthly performance of the Dow Jones Industrial Average over the last 5 years. The bars indicate the percentage of time the index finished positive that month and the bottom number indicates the average move. One of these months is not like the others. If you said September, you are correct! In the last 5 years, the market has moved down an average of -4.2% in September and hasn’t finished higher in any of those years
Fine, the last 5 years have been unique, so let’s zoom out to see the last 10 years. Hint – September doesn’t look much better.
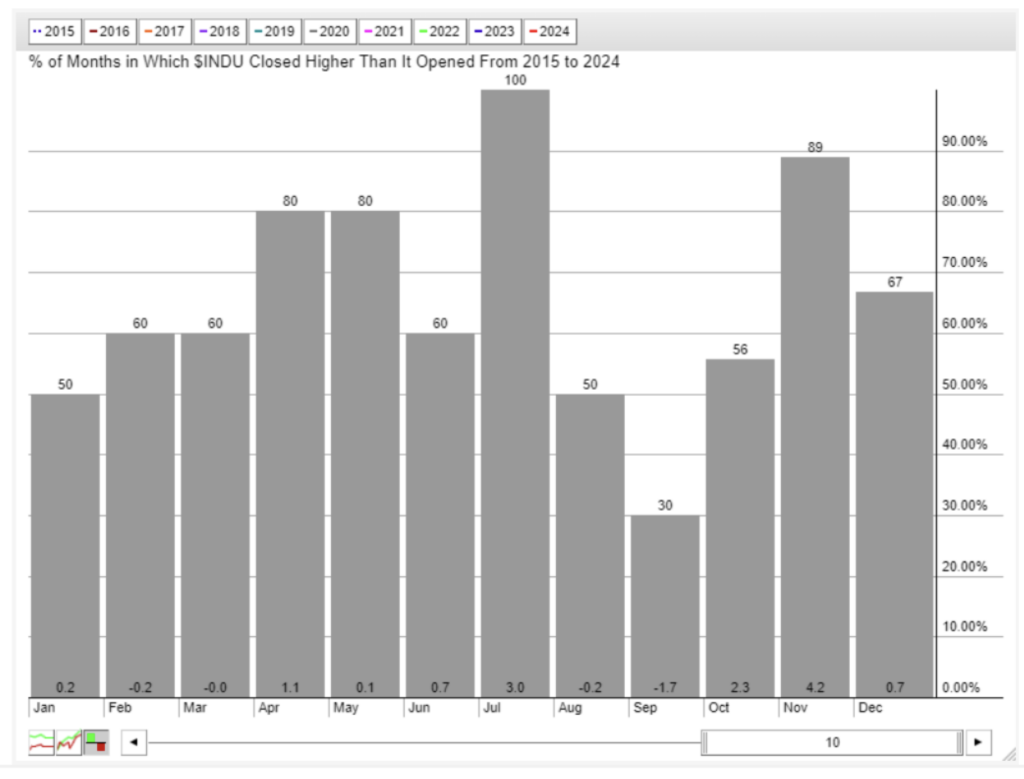
It wasn’t always this bad. The period from 2005 to 2013 saw September in third place in terms of average positive monthly gains.
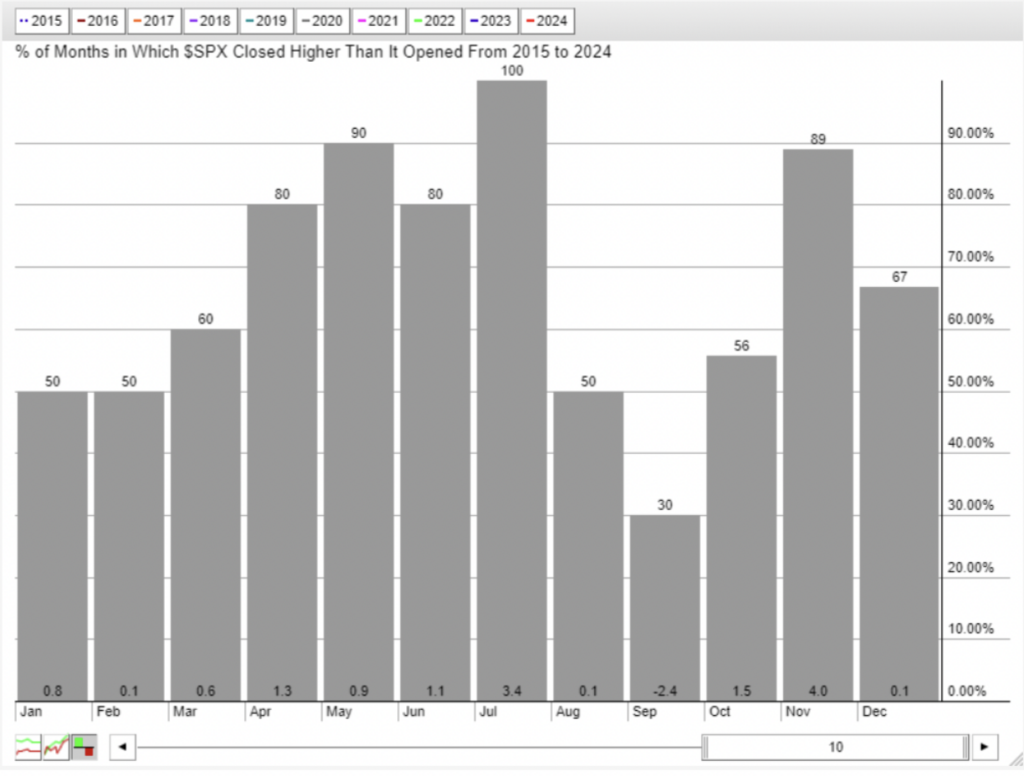
What about the S&P 500 and the Nasdaq? Here’s 10 years of data for the S&P 500:
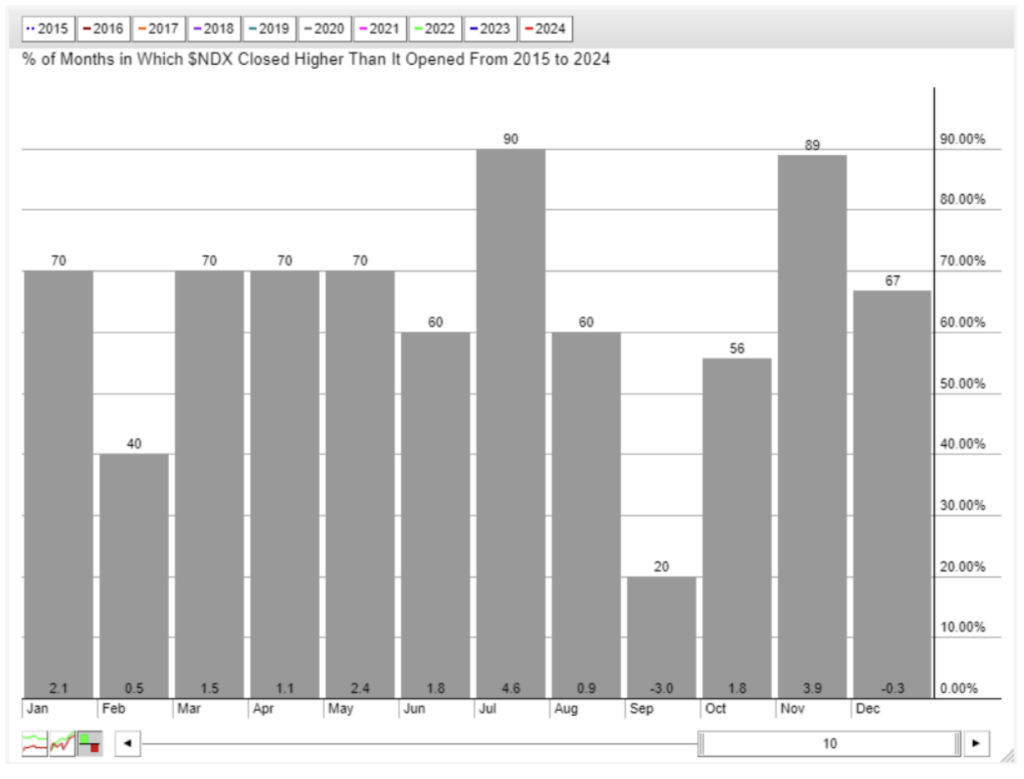
And here’s the Nasdaq-100:
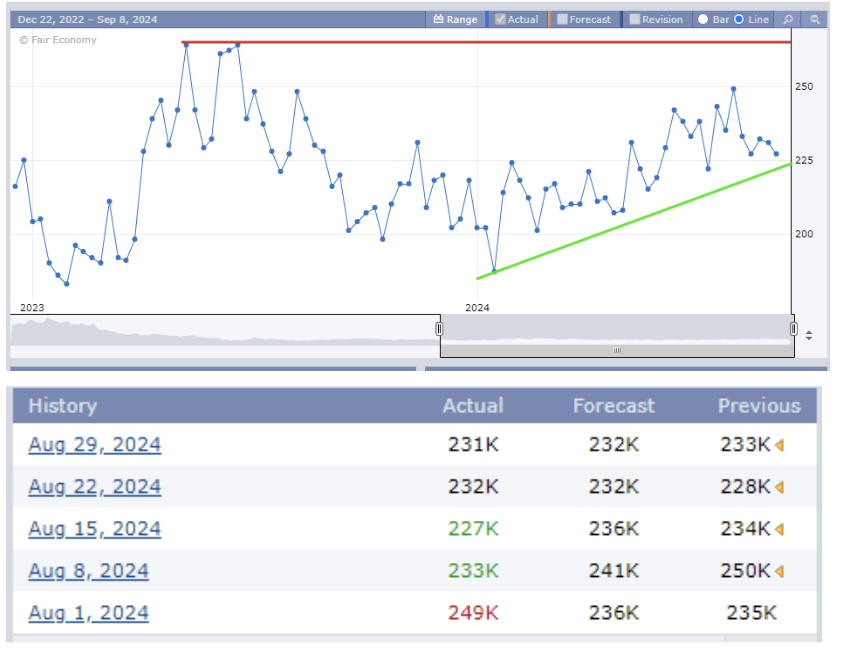
What is causing the bearish behavior this year? Well, the latest JOLTS Jobs Opening report showed 7.67M job openings versus the forecasted 8.09M number. And the actual number fell below July’s 7.91M.

Is the economy falling apart? Is there hope for a soft landing, and whatever happened to the spending spree around AI that saved the market earlier in the year?
Depending on how you want to look at it, the number of new unemployment claims is rising (and has been for all of 2024), but it’s still off from the 2023 highs and is much lower than the number a few short weeks ago. We’re not seeing that spike in unemployment, and the holiday season is right around the corner.
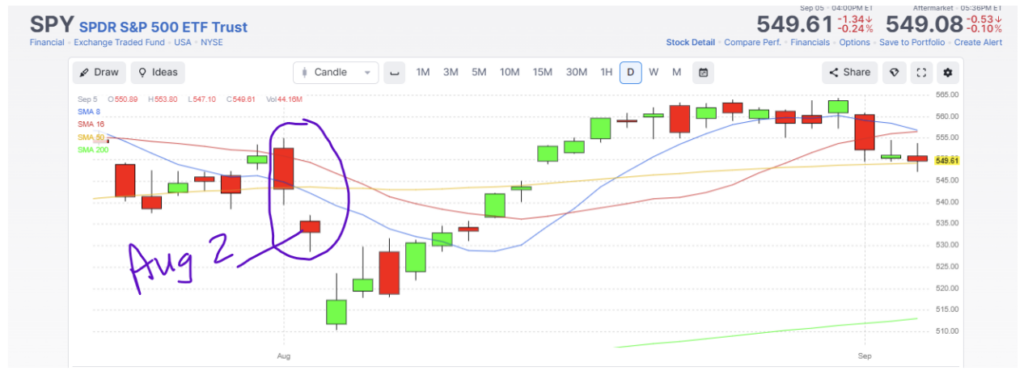
Everyone has their eyes on the August jobs report, but will it matter to retail investors? If you recall, last month the Forecast was for 176k jobs, and only 114k jobs were reported on August 2nd. Sure, the market recovered a couple of weeks later, but it was a rough couple of weeks. Once again, the market sits atop its 50-day simple moving average, acting as a very thin line of support, as it did before the August jobs report.
Will it be as big of a deal as the August report? I don’t know how retail investors will react, but the price action we’ve seen in the last two weeks or so is reflecting what I believe to be institutions preparing for the economic slowdown – at least until the Fed makes a move on interest rates.
We already know the jobs are slowing and inflation is coming down. That’s why the Fed said it’s time to cut rates. The question becomes how much will the Fed cut rates and how quickly. We know that Powell likes the slow and steady approach as other options will signal panic.
If the jobs data is better than expected, we will see a 25 basis point from the Fed for their first cut. If the jobs data is horrible – and I mean missing the mark as bad as August, it will signal that the Fed is too late and people will cry for a 50 basis point cut. And if the numbers are in line with projects it means that we have a slow grind down as the possibility of a recession is still unknown.
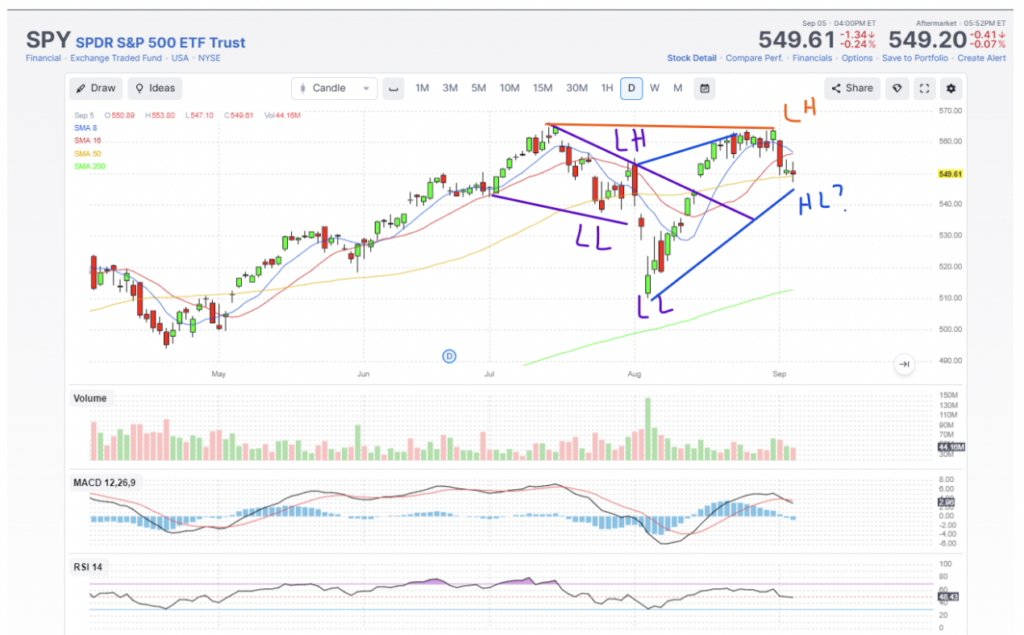
The chart of the S&P 500 is a difficult read right now. In August we experienced lower highs (LH) and lower lows (LL), but the end of August gave us a rally to give us a higher high and maybe a higher low, so while that seems bullish, if you connect the orange line from the July high to the August high, you can see that we put in a lower-high. It seems as though the market structure has changed and being on the defensive side will likely be the better move for the next month.
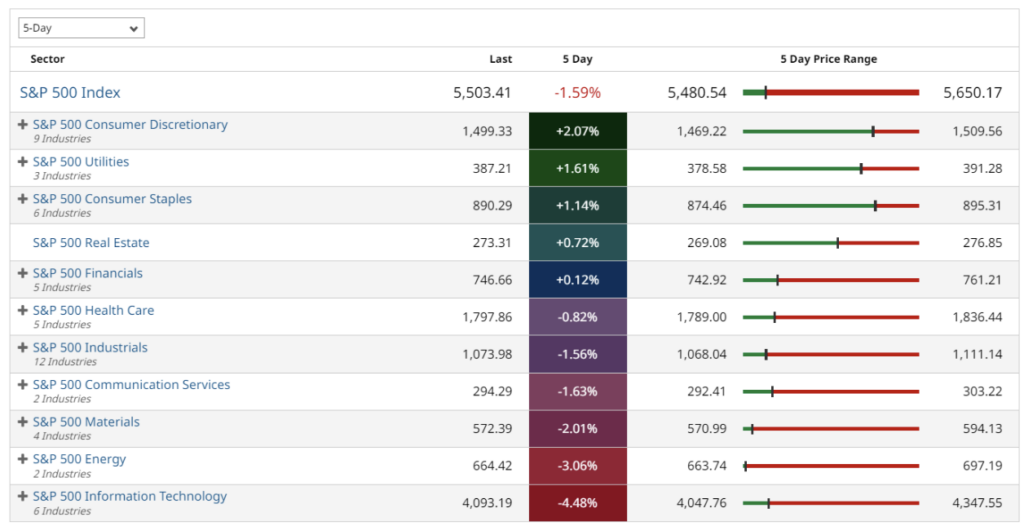
Even when the overall market is weak, you can find winning sectors. I’ll leave you with the 5-day performance compared to the 1-month performance of top S&P 500 sectors.
Here is the 5-day:
And here is the 1-Month:
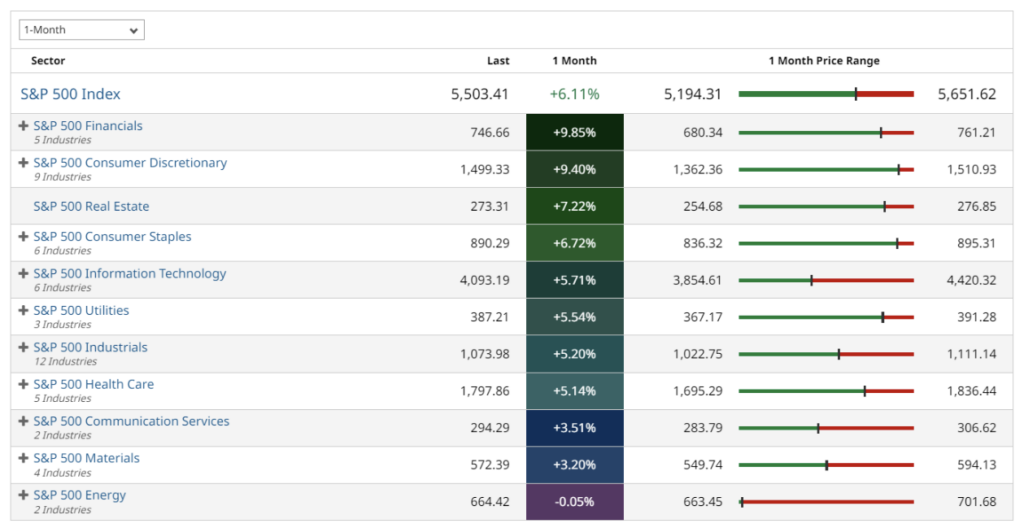
Consumer Discretionary is still showing strength. Financials have slowed down some over the last 5-days but could be gearing up for another move higher. Real Estate is another one that is strong in both time frames. Keep drilling down on the strong sectors to see which stocks are carrying the sector and which stocks are ready to join the party. Who knows, maybe Information Technology is oversold at this point, given the performance over the last 5 days compared to the month. It may be time to start adding some of those oversold names to your radar because the last quarter of the year is typically bullish.