S&P 500: Record Highs but Caution Lingers
The S&P 500 capped off last week with another record close, brushing against 6,100. That’s a 27.68% gain for the year. But here’s the catch: signs of fatigue are starting to creep in. We can look at indicators like MACD and RSI to help determine momentum. The momentum has remained bullish as long as the RSI can stay above 50, but we are getting a fresh bearish cross on the MACD. With that in mind, I’d look for a pullback to either the 20-day exponential moving average (around $6020) or the 50-day EMA, around $5920.
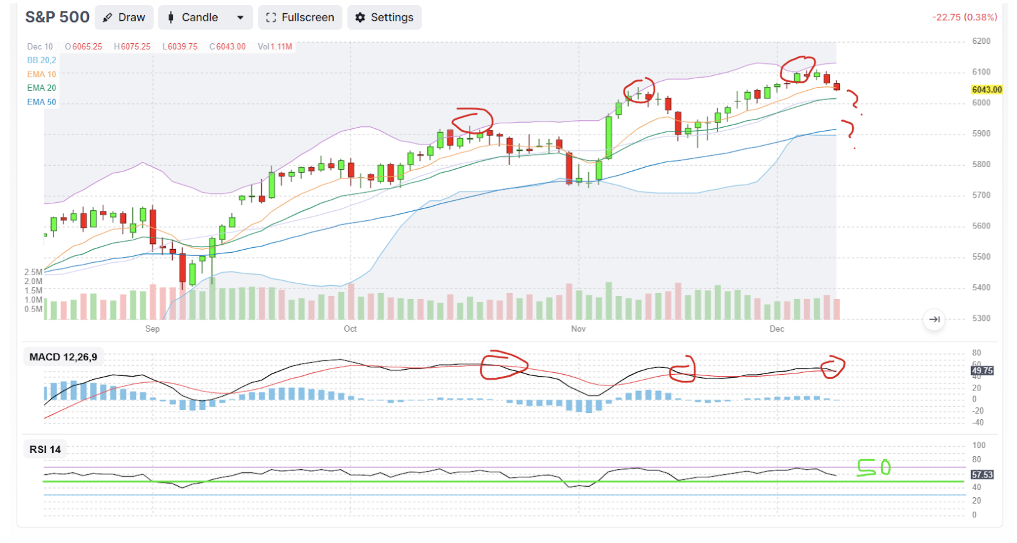
While it’s impressive that the index remains well above key moving averages, not all sectors are pulling their weight.
Who’s Driving the Rally?
This isn’t a market-wide celebration. There are only two sectors that have had a positive return in the last five days and only five sectors are showing a positive return in the last month.
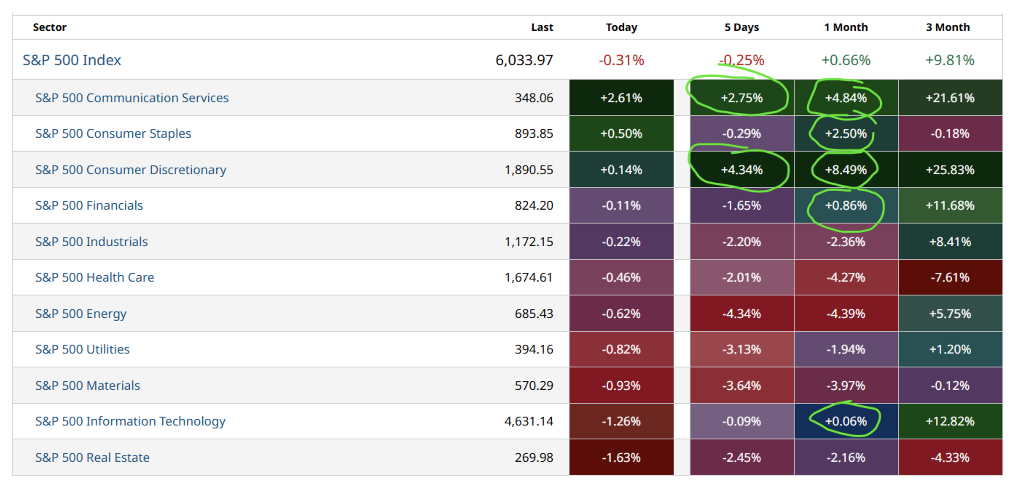
It’s clear: the market is leaning heavily on a few key players. If these leaders stumble, the ripple effects could be significant.
Breadth Issues: A Red Flag
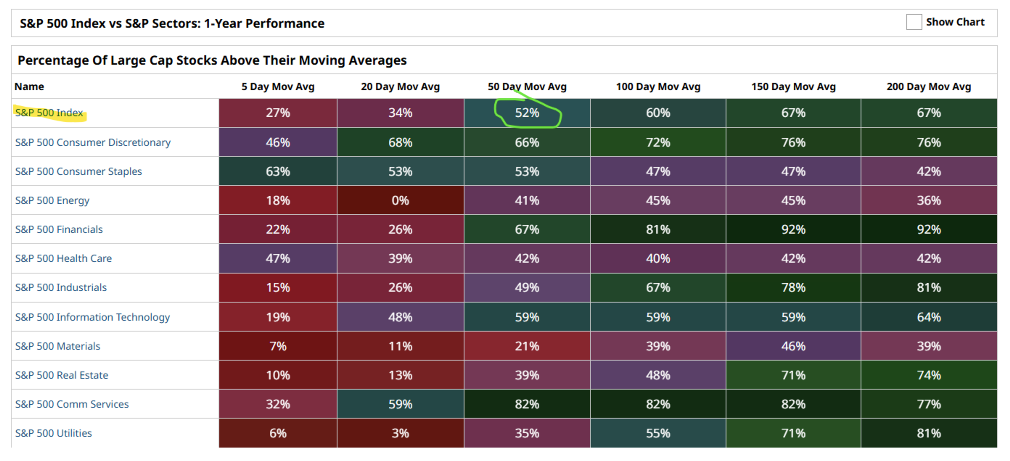
Market breadth took a noticeable hit. Only 52% of S&P 500 stocks are above their 50-day moving average. It is important to note that the number of stocks above their 5-day moving average shows that the selling might be overdone in the near term, but stocks can certainly stay below their moving averages for long periods.
Bitcoin Soars—But for How Long?
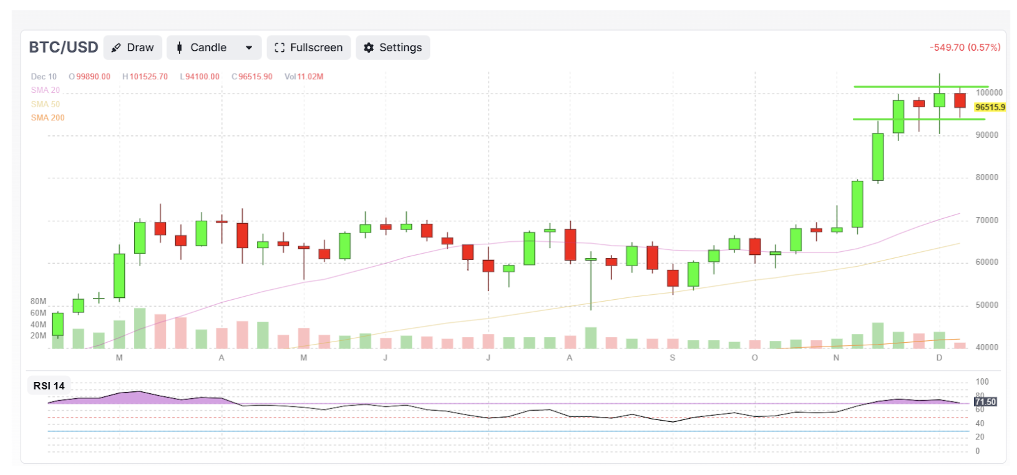
Bitcoin broke above $100,000, an eye-popping milestone. Yet technical indicators tell a different story. RSI has rolled over, and the lack of confirmation on recent highs suggests traders aren’t fully convinced. If Bitcoin dips below key levels like $94,435, we could see a rapid pullback.
What’s Next?
In terms of seasonal patterns, we are going through a standard mid-December drop before the last push higher to finish the year. Will this year be different? The week of December 16th then turns bullish through the first trading day of the year.
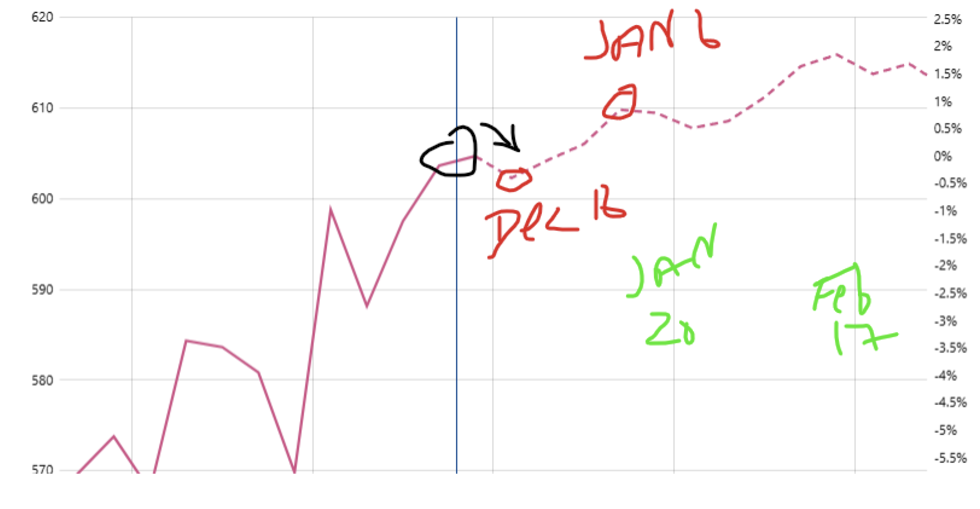
Well, that’s what the average seasonal pattern looks like over the last 30+ years. History is on the side that this too shall pass and we may see that bounce off the 20-day exponential moving average rather than a drop to the 50-day from the earlier chart I showed.
What could change the current picture and inject some optimism back into the markets?
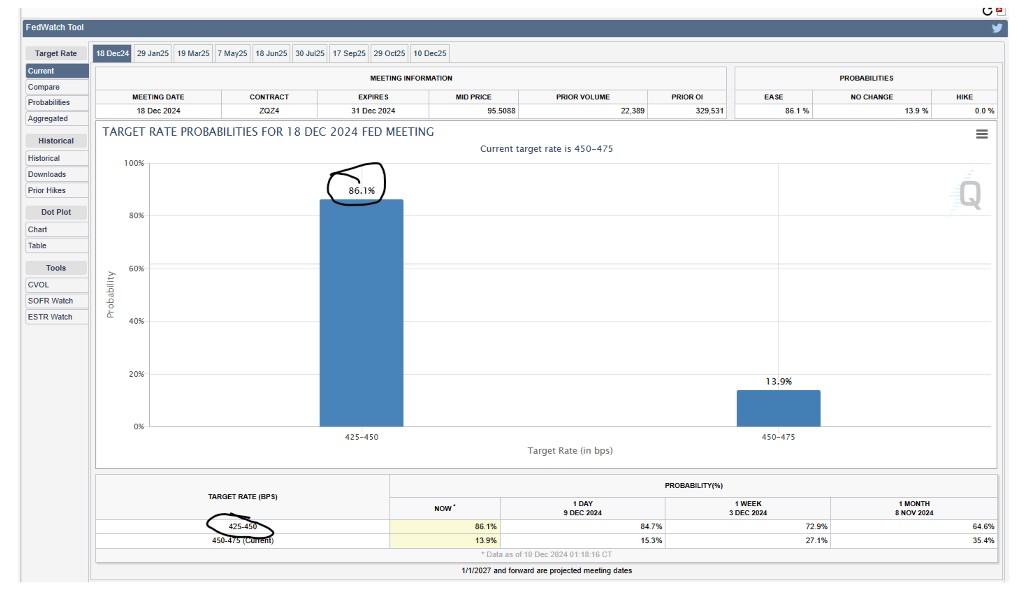
This week it will be the Consumer Price Index and Producer Price Index reports and next week the Fed will meet to determine if another rate cut should take effect. The odds are showing an 86.1% probability the Fed will lower the Target Rate to 425-450, down from the current Target Rate of 450-475. That may inject some life back into the market, but watch out for that 13.9% chance of no rate cut.
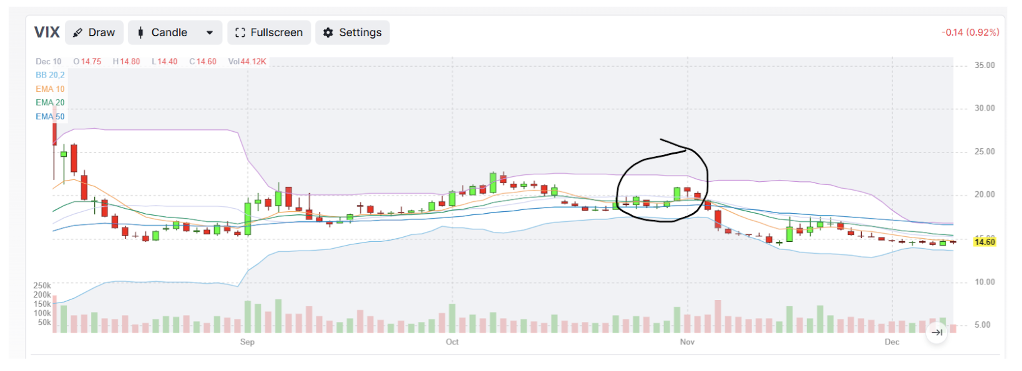
What else makes me think this could be a temporary setback? We’re not seeing a spike in the Volatility Index (VIX). Look back at the left side of the chart, which lines up with the August market selloff. Even at the end of October when the market took a break we saw the VIX up near 20. The VIX doesn’t seem to be showing fear in this latest market pullback. It doesn’t mean the VIX is right, or that it can’t gap up quickly, but so far we haven’t seen fear come back into the market.
The S&P 500’s rally has been remarkable, but cracks are forming. If leadership falters or macroeconomic conditions shift, the market could face heightened volatility. For now, the focus should be on safeguarding gains rather than chasing additional upside. Diversification and a cautious approach might be the best strategies as we edge closer to 2025 – or at least for the rest of this week.


