Major Indices Snapshot
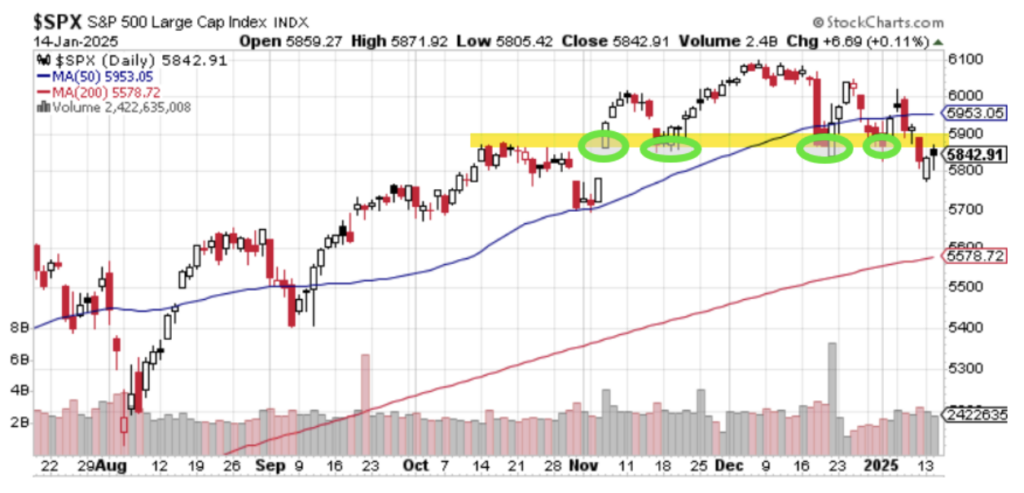
The S&P 500 is flirting once again with this area between 5800 and 5900. It’s the area that we gapped up to with the November elections in the U.S. Every other attempt to go lower was met with enough support to move the markets higher. Until last week…

Last week’s job data seemed to seal the deal in investors’ minds that rate cuts are going to be hard to come by this year and we might even get a rate hike!
The market dipped below that key level with the recent selling. We’re now back up to that level, but this time as an area of potential resistance rather than support. With the Financial sector earnings starting off today, we will see if we can break through that resistance or if we’re going to find those lower support levels.
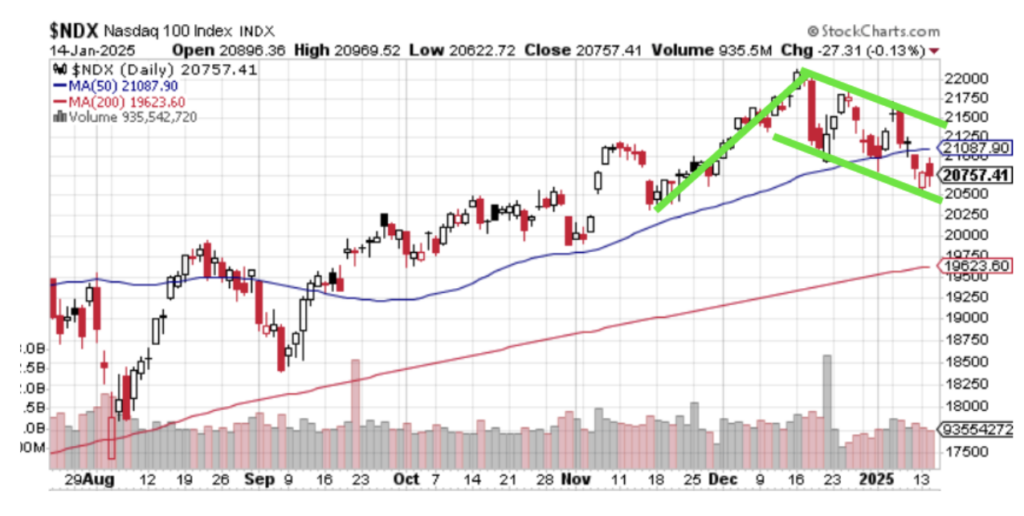
The Nasdaq is trying to regain its 50-day moving average, but it has been steadily declining since December. Is this the start of something bearish or just a bull-flag pattern forming?

Whatever happens with bank earnings this week, don’t put too much behind it. Despite their initial earnings-related moves, the early bank stocks like Goldman Sachs, and JP Morgan Chase tend to flatten out a week after their respective earnings dates. So don’t read too much into the market moves until we get thicker into earnings season.
Earnings in the Spotlight
According to FactSet, the estimated (year-over-year) earnings growth rate for the S&P 500 is 11.7%. If 11.7% is the actual growth rate for the quarter, it will mark the highest (year-over-year) earnings growth rate reported by the index since Q4 2021.
According to the latest earnings projections for Q4 2024, 71 S&P 500 companies have issued negative EPS guidance, and 35 have issued positive EPS guidance.
The forward 12-month P/E ratio for the S&P 500 is 21.5. This P/E ratio is above the 5-year average (19.7) and above the 10-year average (18.2).
If the Fed stops easing rate cuts, investors will want to know if companies can continue to operate and show demand for products and services that support an “over-evaluation” environment.
That said, it’s important to remember that over the past decade, S&P 500 companies have, on average, reported earnings 6.7% higher than estimates, with 75% of companies surpassing mean EPS expectations. As a result, the earnings growth rate has risen by an average of 5.4 percentage points by the end of earnings season, driven by the frequency and size of positive surprises.
Economic Reports to Watch
This week brings several critical data releases that could shape market sentiment:
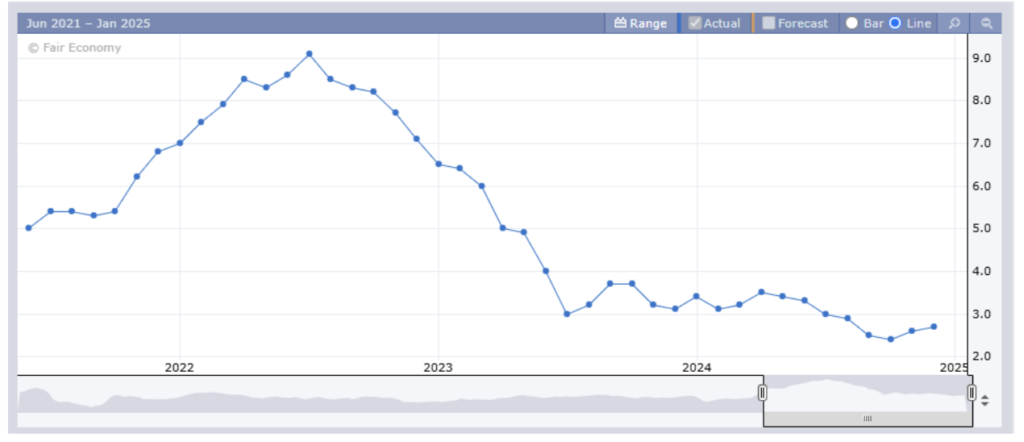
- Consumer Price Index (CPI): A cooler inflation print could signal relief for markets, while a hot number might reignite rate hike fears.

The CPI has been dropping and edging closer to that 2.0% goal year-over-year, but the last couple of reports have shown the number creeping higher. While the previous report was 2.7% y/y, the estimates this time around are 2.9%.
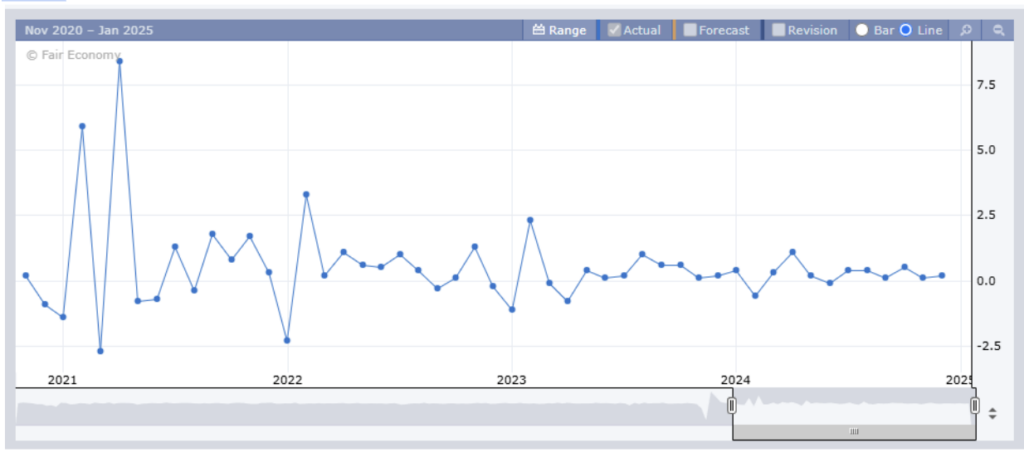
- Retail Sales Data: If we’re in a “good news is bad news” economic cycle, we want to see a decrease in spending, which would help the idea that inflation has a chance to cool.

The Forecast, however, shows an increase from 0.2% to 0.5%. Will that be enough to spook investors on Thursday?
Final Thoughts
Whether you’re a bull or a bear, there’s plenty to digest in this week’s market action. Earnings, economic data, and technical setups are all creating opportunities—and risks. Stay sharp, keep an eye on those support and resistance levels, and let the VIX guide your risk management strategies.


