

Why This Pullback Is Different And What You Can Expect To Happen As A Result
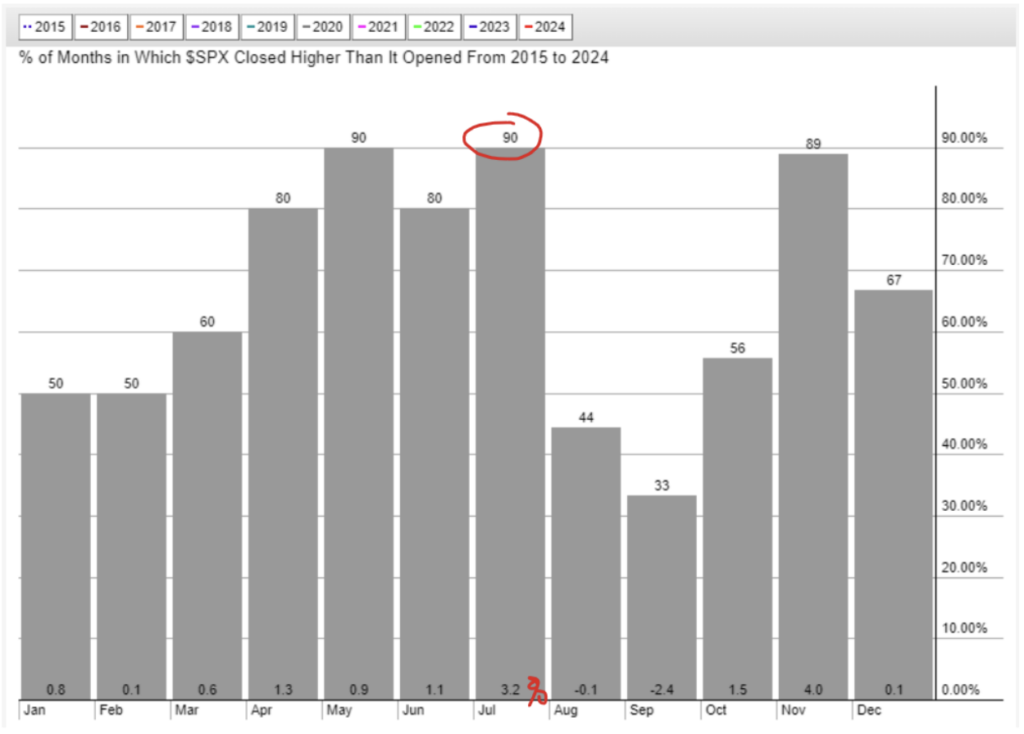
July has historically been a strong month, thanks partly to the earnings season. Over the last 10 years, the S&P 500 finished July higher than it started in 9 of the 10 years, with an average monthly gain of 3.2%!
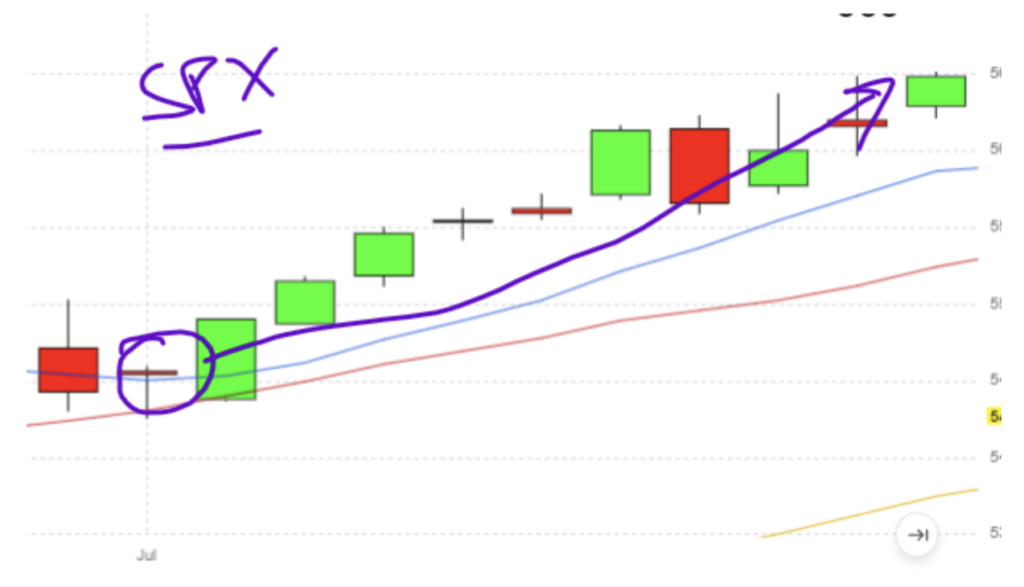
Things started as expected for July. The S&P 500 continued higher through July 16th.
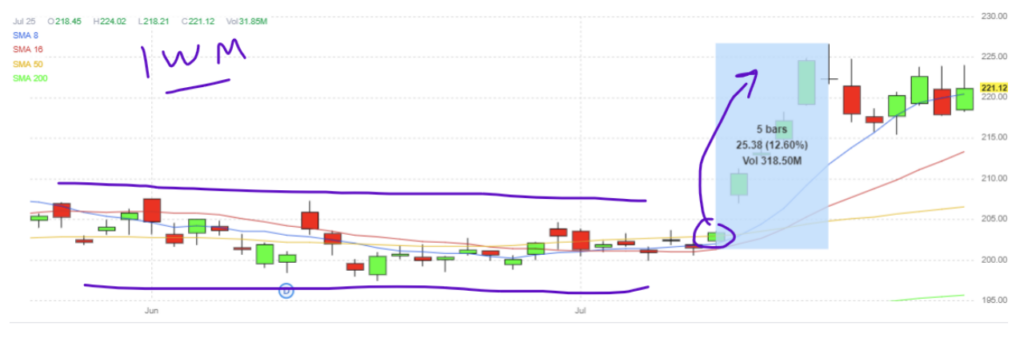
But as more optimism grew for a September rate cut from the Fed, investors pivoted away from the Mag-7 stocks that were responsible for the majority of the yearly gains already and ran for mid-cap stocks that would benefit from a rate cut and haven’t moved this year. It was a very quick rotation from mega-caps to small/mid-cap stocks, as seen by the Russell 2000 gain speed after being flat most of the year.
The IWM (Russell 2000 index ETF) gained as much as 12% in five trading days!
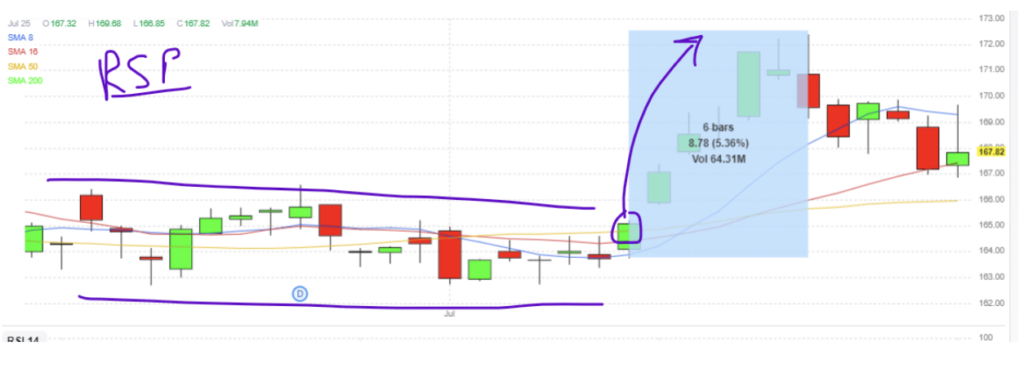
The equal-weighted version of the S&P 500 also showed rate-cut optimism as the rest of the index finally participated in the rally. The equal-weighted S&P 500 ETF rose over 5% in 6 days!
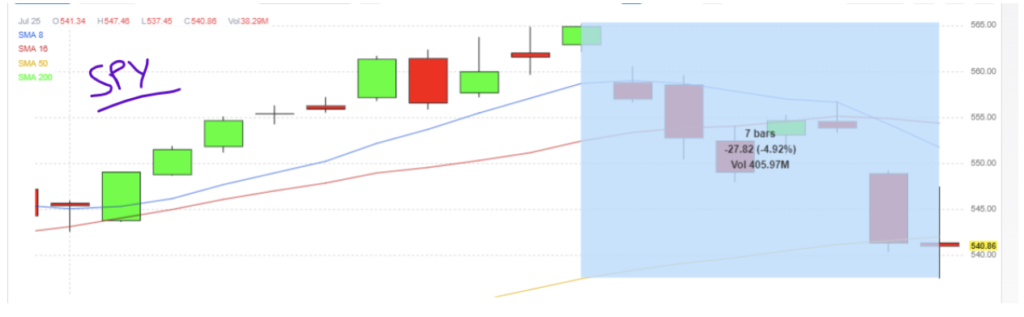
So, with all the bullish seasonality, rate-cut optimism, and a broader participation rate in a market rally, why did everything go so wrong so quickly? The SPY dumped nearly 5% in 7 days, with a massive 2% drop in a single day.
Remember a few weeks ago John Hutchinson said eventually bad news will be received as bad news from investors. Eventually, bad news will show a softer economy, and while it may help inflation, a softening economy may eclipse the inflation story.
Global Manufacturing data was disappointing. Tesla, Alphabet, Visa, and UPS all pointed to a lower future guidance. Even NY Fed President Bull Dudley called for the Fed to cut rates as early as next week due to labor market worries, which is a vastly different stance from the previous ‘higher-for-longer’ position. Oh, and that code hiccup from Crowdstrike that affected Microsoft systems didn’t help either.
But the selling pressure from some of the leading companies in the world is what is ultimately hurting the markets and why this pullback isn’t as bad as it may seem. Sure, I’m not happy about my accounts – I feel pain like everyone else. But this isn’t an economic issue to be feared, as much as it is one to weather.
We won’t remember this pullback if Microsoft or Nvidia deliver solid earnings. Anytime indices rise by 5 or even 10% in a matter of days will lead to a reversion to the mean.
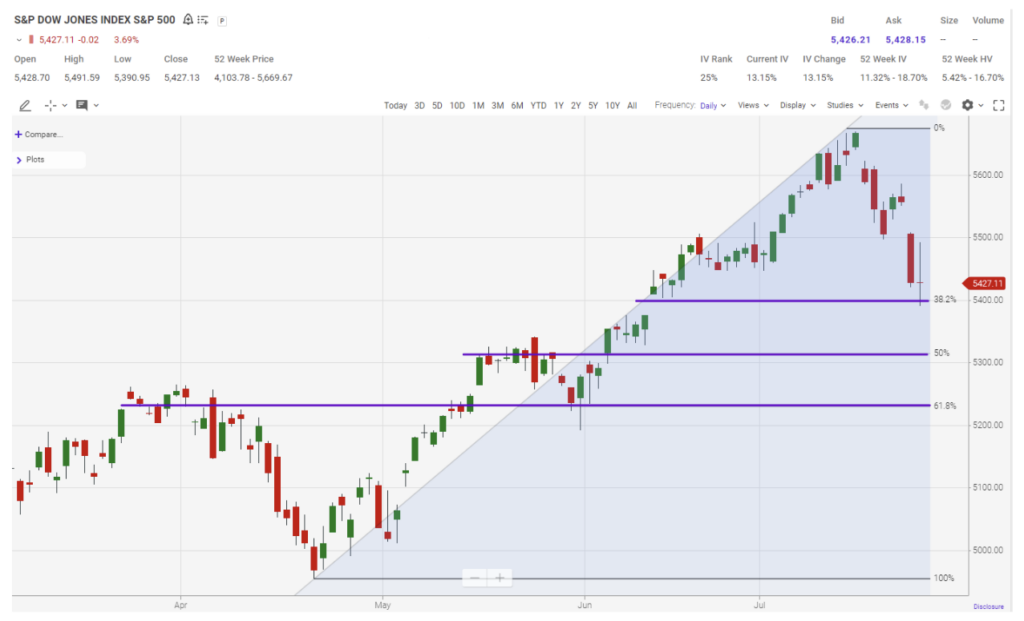
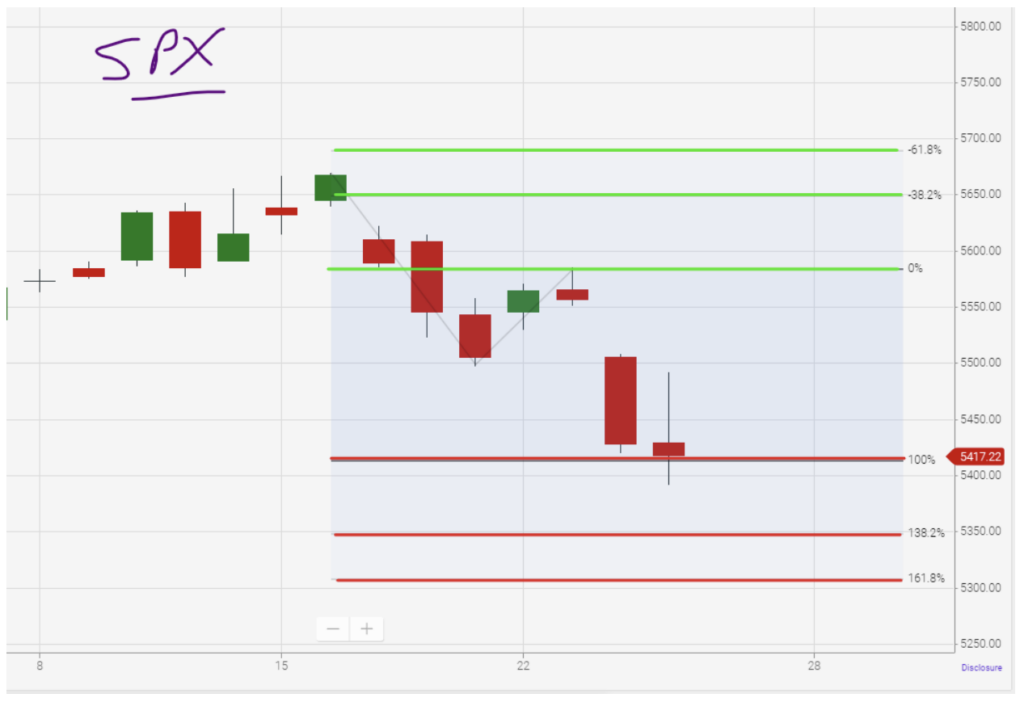
Here are the levels you can watch for in the S&P 500. For a reversal to occur, look for a candle with a large wick on the bottom, a gap up, or a big green bar. Look for that to happen around one of these key levels.
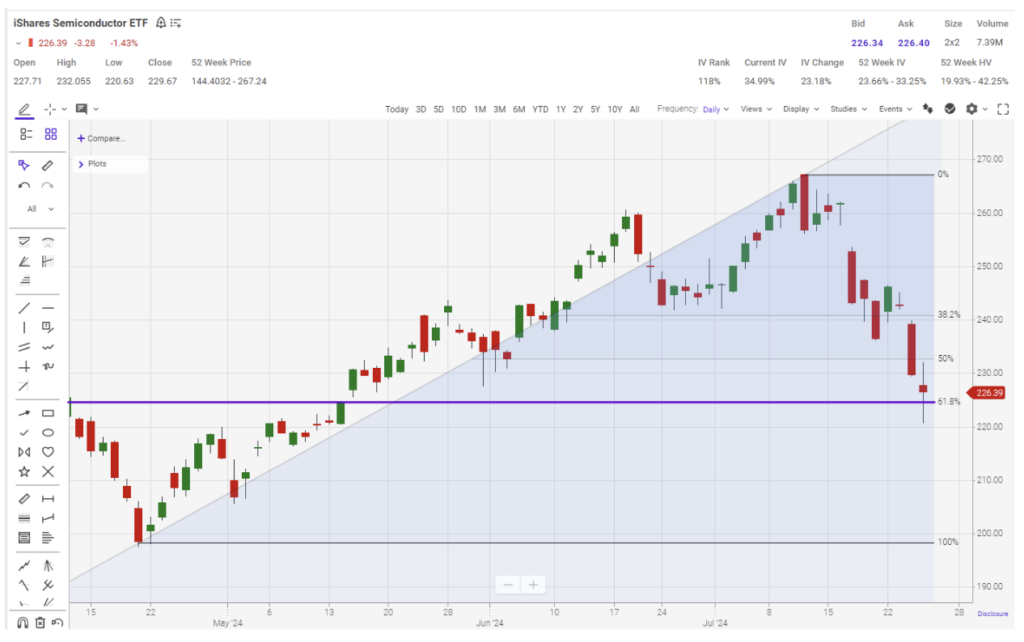
You can also expect the markets to continue higher if the Semiconductor sector finds an area of support. It’s close to a pivotal level right now.
However, if tech continues to lower future earnings expectations, you can expect the broader market to fall. Here are the potential pivot support and resistance levels I’ll be watching.
With that, we will see what the market throws our way next week. We have an FOMC statement and a variety of unemployment data to digest.