During our Investor’s Blueprint Live conference in February, and again in an article here on Traders Reserve, I recommended Nextracker (NXT) as a post-IPO, small-cap stock worth owning as a ‘foundation’ stock in the solar industry.
Today, I want to share the value of assessing your stocks across different timeframes and validating whether shares should still be held.
But, I’m going to do it in an unusual way…
If you missed our stock on NXT, you can catch up on it here
One of our members, Chris Y., owns NXT shares following my earlier recommendation and wrote to me on May 7 with valid concerns about the stock’s performance during the April-May period, when the price of NXT declined from $58 to $45 per share.
His question was simple: “Can you provide some updated perspective on why this is under performing?”
I spent time working through charts and data, and this is what I sent back to Chris (verbatim):
- I would wait until May 14, when NXT is due to report earnings, before assessing anything about the company. Remember that it’s a 13-month-old IPO and the long-term chart, while volatile in the last month+ is still moving higher.
- Last 3 Q’s have registered large earnings surprises to the positive; if that trend holds, I would be surprised if the stock price didn’t reclaim the $53-$57 range
- On all three timeframes (D/W/M – attached) NXT is holding critical support levels (200-day on daily; 50-period on weekly and matching lows on A/M monthly which trace back to resistance in the (2022) Jul-Sep period.
- Stock is held by: VTI, VB, VBK, VXF, ICLN, TAN, SCHA, VTWO – that’s not a small list of institutional backing!
- Note IWM chart breakdown in early April matches NXT chart as small caps took a much larger hit with hawkish view of Fed (and, neutral Fed is equally harmful in the SHORT term – but the Fed will cut rates at some point in 2025 (at least).
- I don’t see any change to the expected earnings forward for the company, so it comes down to actual earnings performance (or surprises + or -).
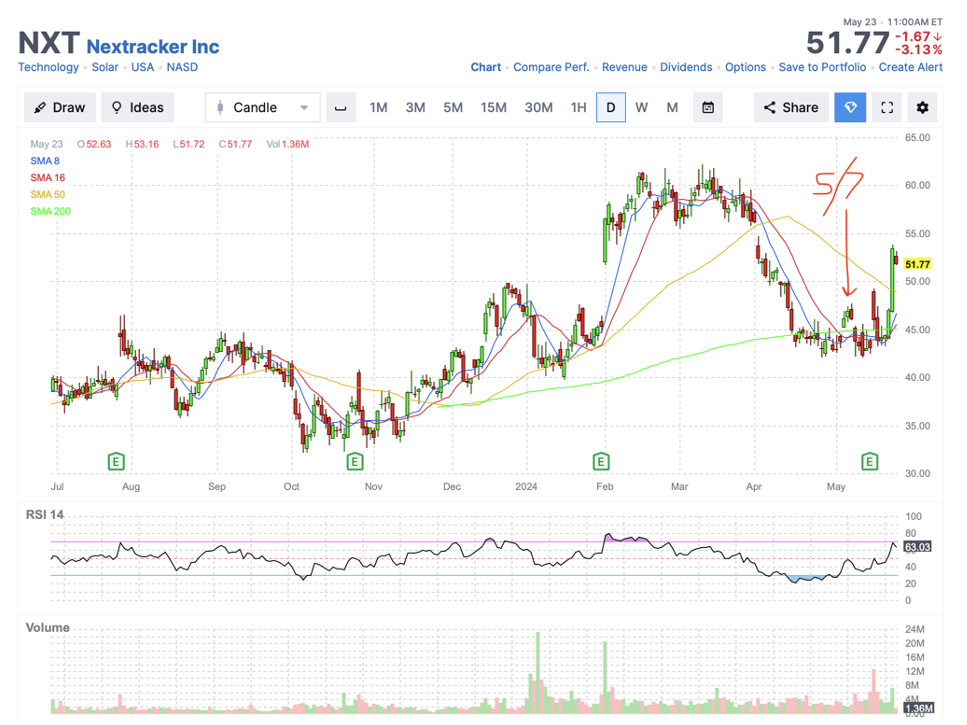
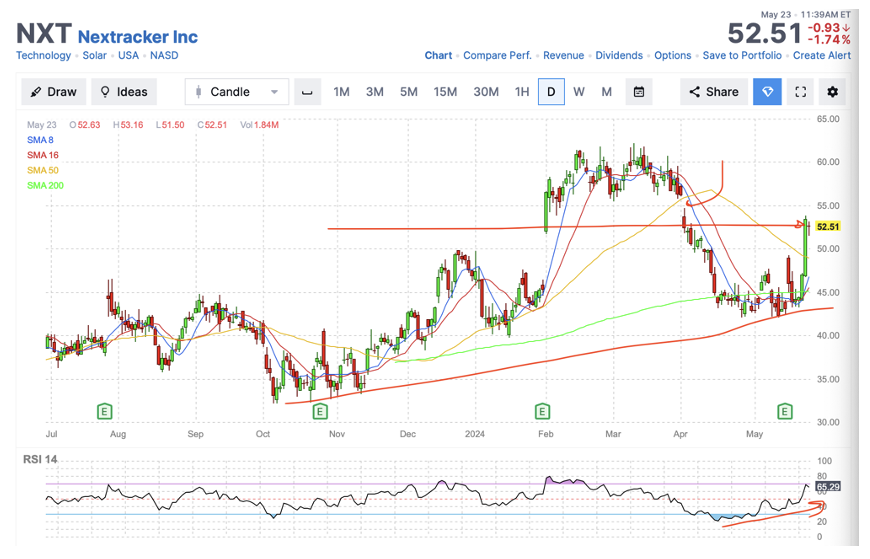
Let’s look at the 12-month chart with May 7 (date of the email exchange) highlighted below:
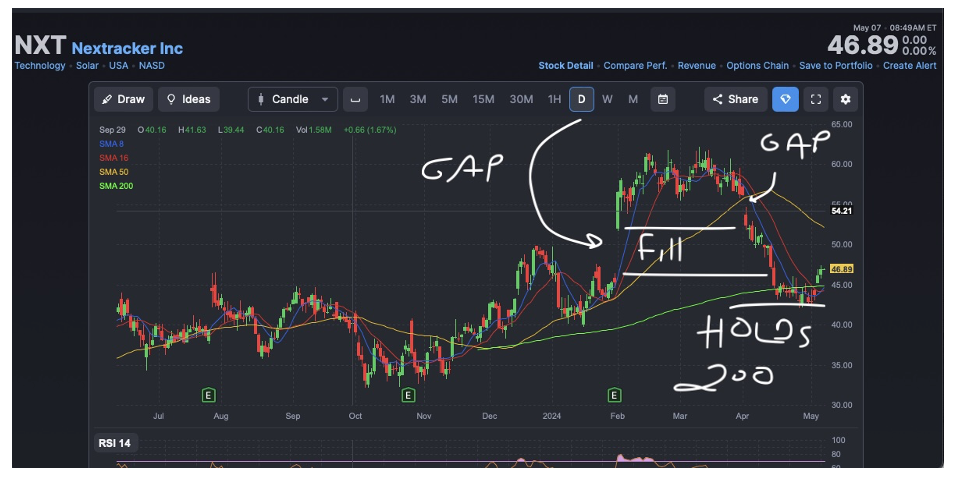
Next, I’ll share the charts I sent Chris which I used to support my analysis:
Daily Chart – significant gap filled in recent sell-off, but 200-day MA holding.
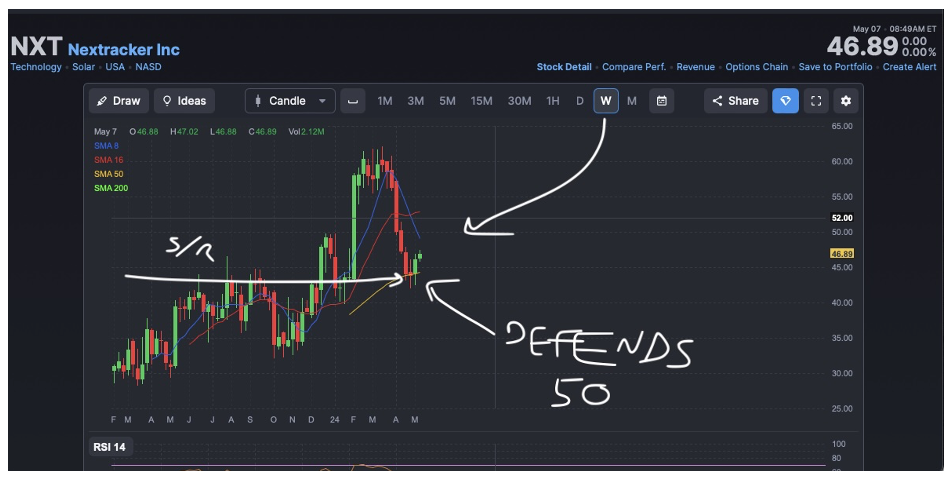
Weekly Chart – note the long-term (one year) support/resistance line and the bounce off the 50-period moving average (defending the 50).
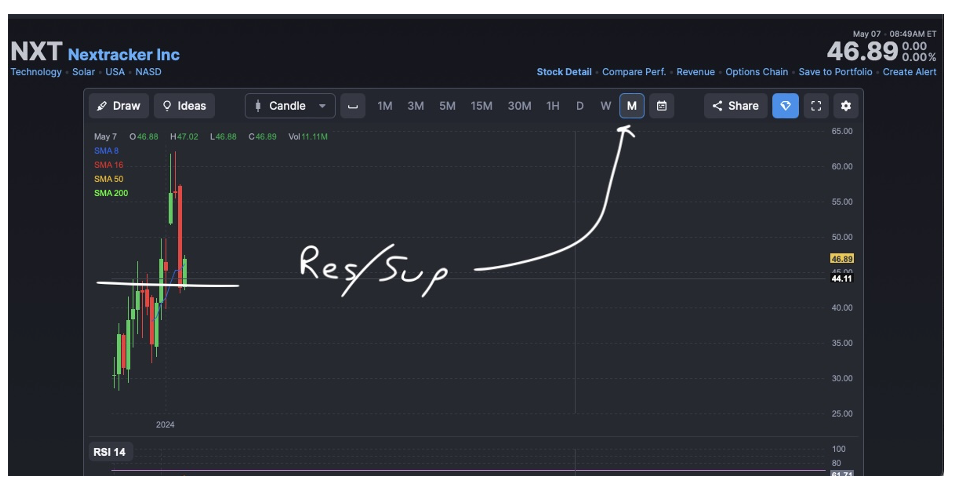
And finally, the Monthly Chart: while this has less technical data to work with, due to being an IPO, the defense of the early-stage support/resistance line justified to me that the stock had stabilized in the $45 range.
My primary point, though, was to wait for earnings, which were due out on May 14, and to see if NXT outperformed earnings expectations with surprises to the upside, which the company did:
Beat EPS by 46% ($0.96 actUal vs $0.65 expected)
Beat Revenue by 7.8% ($736MM actual vs $683MM expected)
You can see the earnings report in the right sidebar of the chart below:

As it turned out, points 1, 2 and 6 were correct: earnings would determine short-term movement and NXT needed to show that it could continue the trend of outperforming expectations.
You would think that with results that positive the stock would move higher. While it did gap higher following earnings, NXT also sold back down to the $44 level; THEN it broke back above the $53 line in the last two days.
Some key technical points:
- RSI is moving higher, confirming the recent breakout in price.
- The $45 level, following a 3-week period of consolidation/congestion, is proving to be a strong support line, dating back to prior resistance in Aug/Sep 2023 and Dec/Jan 2024.
- Significant gap filled to the downside (Feb Earnings Gap up move)
- Small gap remains to be filled to the upside $54-$56 levels
- Rising ‘lows’ trendline – the stock is making higher lows, not lower lows
Certainly, the recent move higher helps alleviate concerns when holding shares and watching the price break down.
But it’s important to do brief analysis on why you’re holding a stock. As you see in this review, the chart analysis showed us that nothing had changed (except the price) and that the rationale for buying the stock remained intact.
As NXT’s most recent earnings report also coincided with the end of their fiscal year, let’s evaluate the long-term potential behind the company, using the Traders Reserve Stock Value Calculator:
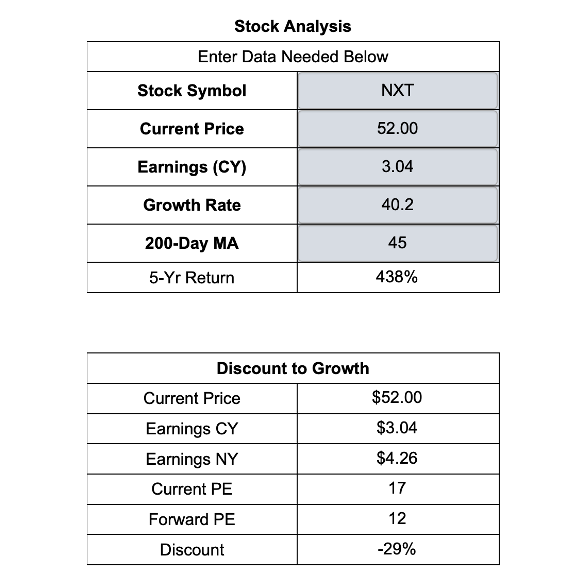
Using Current Year (2025) earnings of $3.04, and a 5-year growth rate of 40%, my long-term projection for NXT is a stock that could return 438% in the next 5 years. NXT is also seriously undervalued for a company printing higher growth targets: a Current Year (forward) PE of 17 is well-below market value; and a next year PE of 12? For a company expected to grow earnings by 12.9% next year, that’s cheap.
Of real benefit today is this: NXT is trading at a 29% discount to future earnings growth. That makes it a value for growth, considering the 5-Year Growth Rate.
My target for NXT is a 1-year price range of $72 to $101 per share, given current earnings projections and actual company performance.
My analysis proved to be accurate (not predictive) and while our original story may have hit the wires at a ‘high’ in the stock price, the value in owning shares of NXT is still there, in my opinion.
Feeling a little better today, Chris?
Full disclosure: for 2024, my 53 shares of NXT, acquired at $46.43 are currently +13% for the year. At a time when small caps are still out of favor by Wall Street, beating the S&P 500 even by a small margin is a good thing.