
July saw the great rotation out of mega-cap stocks into… well, everything else. The Great Rotation helped push the Russell 2000 index higher as investors sought gains on stocks waiting in the wings. It hasn’t lasted though, as growth stocks are regaining strength and value stocks are rolling over. Growth has taken back over, but how long will this last?
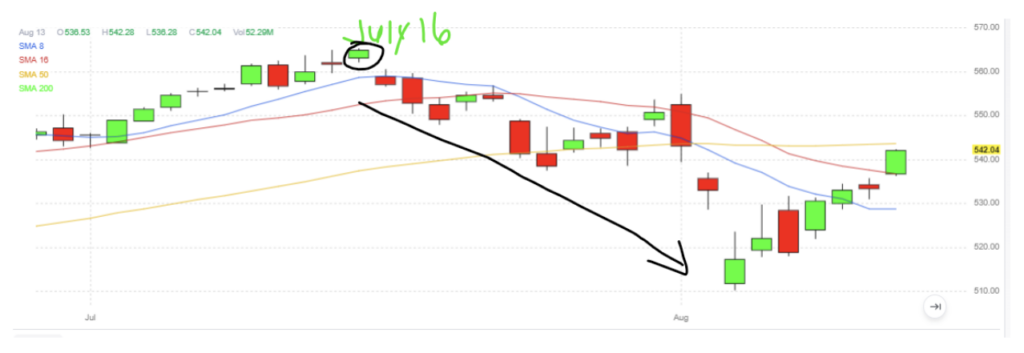
Nearly a month ago, the S&P 500 pivoted lower.
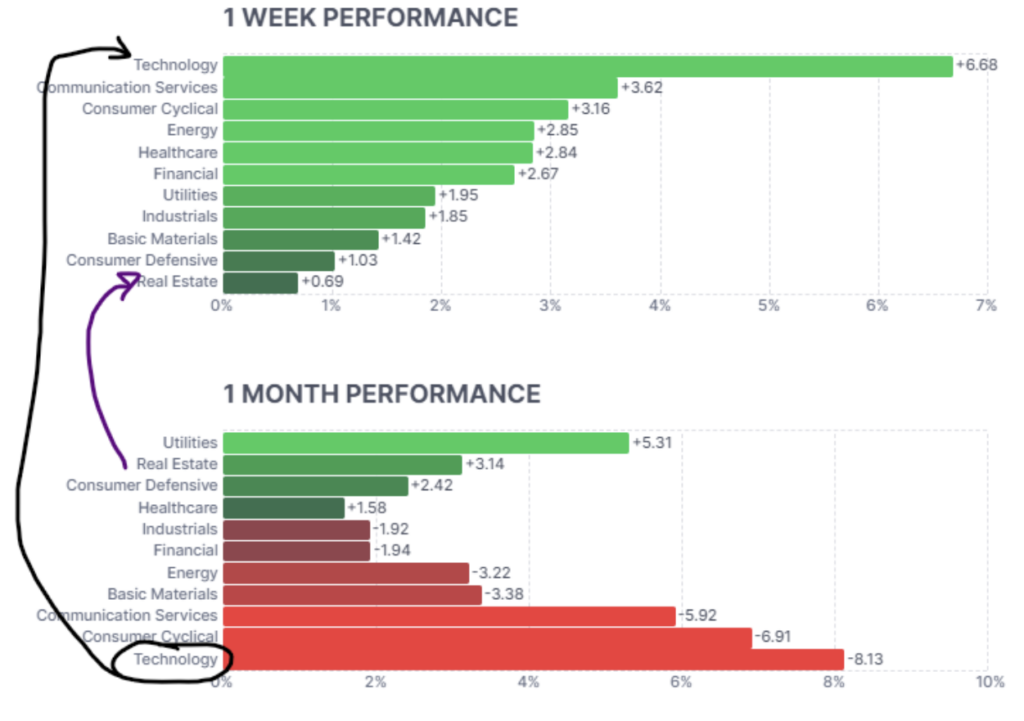
You can see from the relative performance graph, that the defensive stocks have been in charge. Until a week ago, that is. Technology has taken over the 1-week top performer spot, while Real Estate has fallen to dead last.
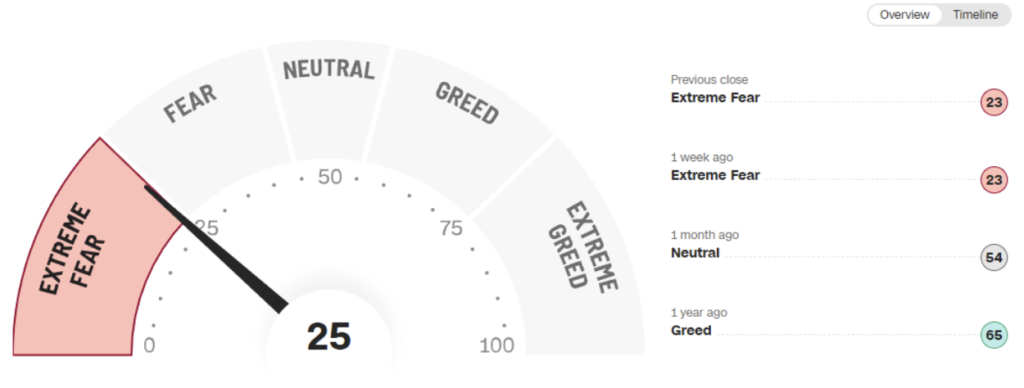
We can see the change away from value stocks in other ways. Let’s look at the CNN Fear & Greed Index. You can see that a week ago, the index was in the Extreme Fear phase with a score of 23. Now we’re on the border of Extreme Fear and Fear, suggesting that investors are still hesitant, but willing to dip their toes back in the water. Should this index continue moving higher, it would signify the short-term bottom is in – for now.
The threat of a recession is certainly still in everyone’s minds, especially with an important Fed date in September. Will the Fed lower interest rates? If so, by a quarter point? Half a point?
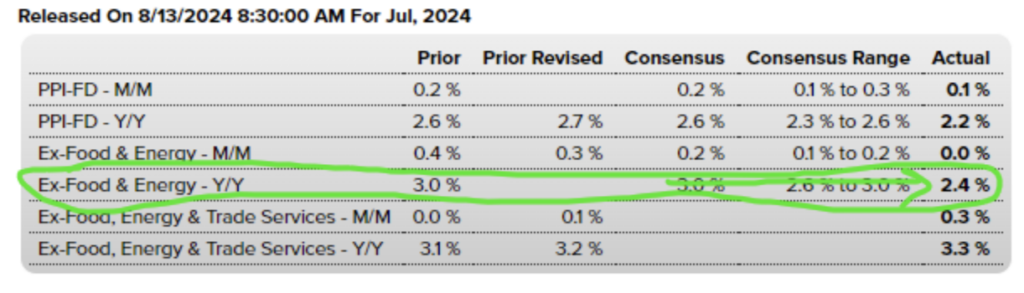
The Producer Price Index report was released earlier and was better than expected, which should help the Fed feel confident that inflation is returning to normal levels.
The Core PCI dropped year-over-year from 3.0% to 2.4%. That certainly helps the bullish cash for the market to resume higher.
However, it’s important to note that the S&P 500 is nearing its 50-day moving average. How it will react at these levels will give us a short-term direction bias.
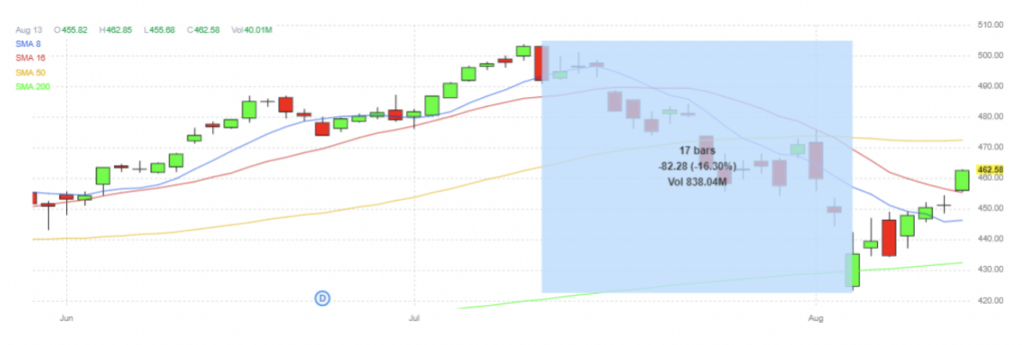
The tech stocks, as shown using the ticker QQQ, fell over 16% but have been on a nice run higher. However, that group of companies is also coming up to the 50-day moving average (yellow line) just above $470.
If growth is back in favor, look for the Semiconductor industry to move higher. The July pullback was stronger than anticipated and created a double bottom after making a series of new lower lows. It’s not the strongest chart pattern, but it would be a bullish sign if SOXX can exceed its previous swing high, around the $235 level.
We’ll see how the rest of the economic reports shape up this week and then on Friday, I’ll be back to look at a few different scan ideas – whether you are bullish or bearish on the market.