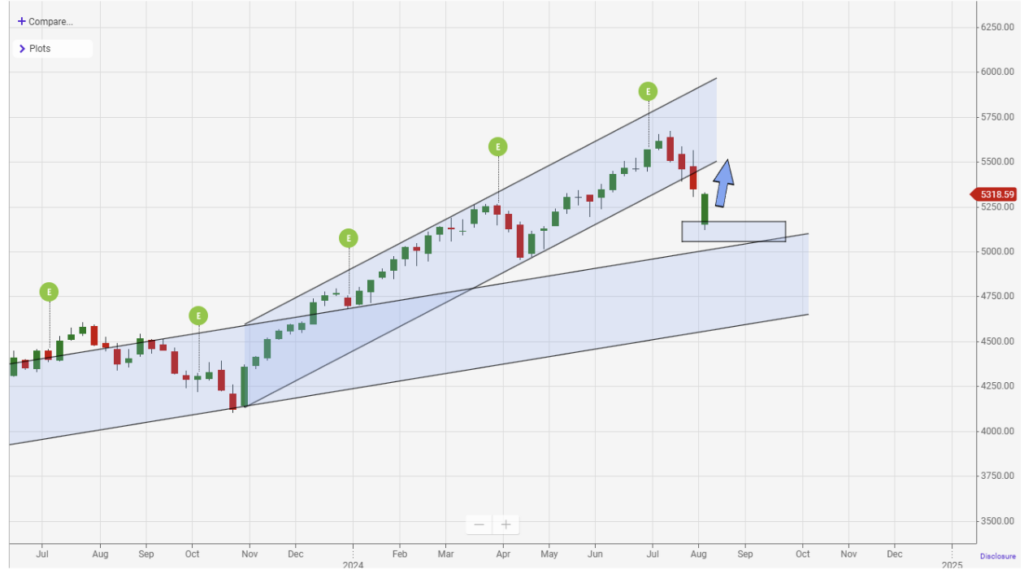
Let’s look at the weekly S&P 500 chart to see where we are in the longer trend. The selling pressure knocked the index out of the upward trend channel that was established in November. The market dropped lower, nearing the top of the previous trend channel before bouncing higher. At this point, I’m looking for the market to retest the lows of the channel. That means heading up to the 5500 level. Keep an eye on the previous swing low around 5000. If we close out a week below 5000, we’d create a new lower-low and that would certainly change the existing market structure.
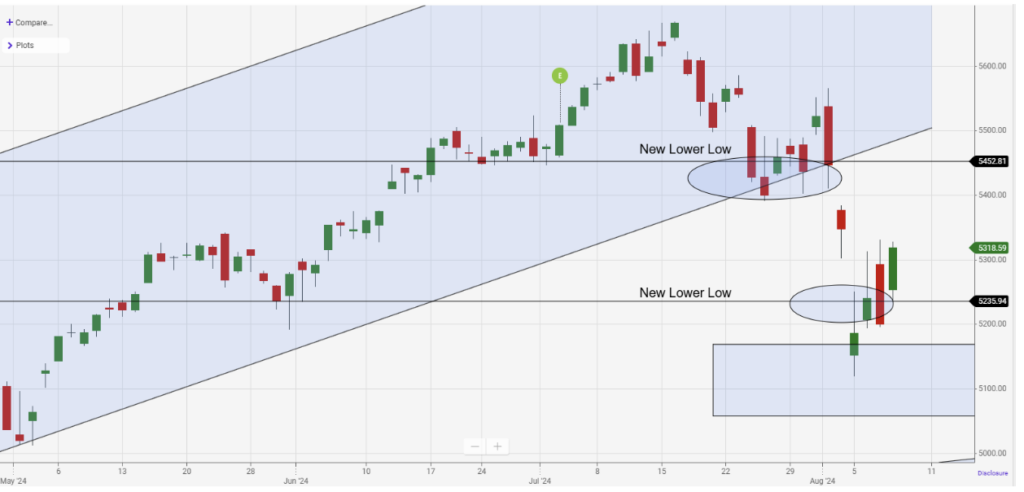
Now let’s drill down to a daily chart. You can see the market made a series of new lower-lows before finally finding support. As the market is rebounding, we need to see it make a series of higher highs. Otherwise, this will be a series of counter-trend bounces. To make a new swing high, the SPX will need to rally to the 5560 level and beyond. That’s a long way to recover.
How could we get there?
The Bank of Japan re-assured investors by saying it would “maintain current levels of monetary easing for the time being.” That helped the markets breathe a sigh of relief that the Yen Carry Trade may be stabilized for now.
Weekly Jobless Claims came in less than expected, showing a slowdown in layoffs – at least for the week. Claims dropped by 17k, but it’s important to note that the 4-week moving average did tick higher, from 238k to 240.75k.

Next week we have a series of economic reports that will also give energy to the roller coaster ride we’ve been experiencing.
Tuesday is the release of the Producer’s Price Index (PPI), which is expected to drop. A lower PPI would show we are winning the war against inflation.
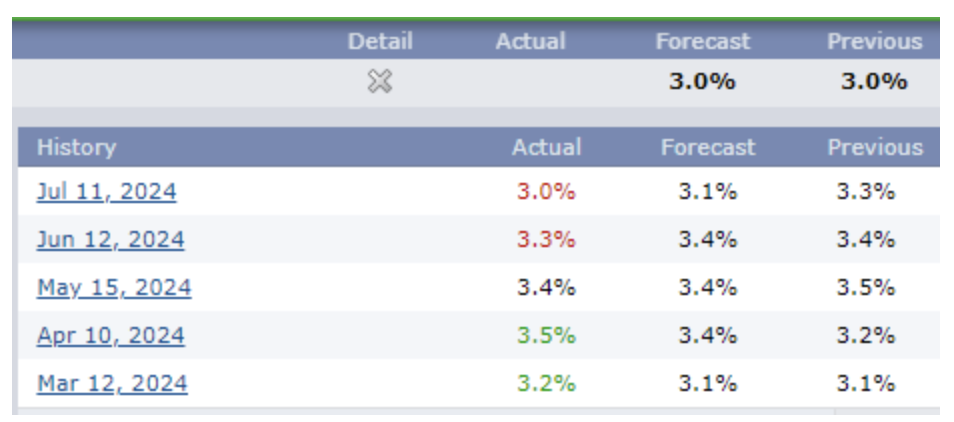
The Consumer Price Index (CPI) report will be released on Wednesday. It is expected to stay flat at 3.0% year-over-year.
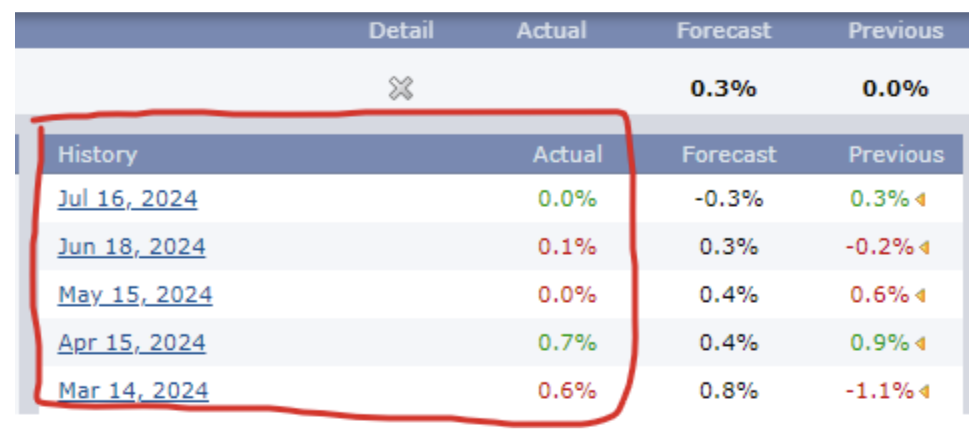
And then on Thursday, we have Retail Sales month-over-month. You can see under the Actual heading that retail sales have been declining over the last few months. Investors are looking for future rate cuts from the Fed to spur economic growth and kick retail sales back into high gear.
In the last 5-days, despite some bullish trading days, most sectors are lower. However, the Defensive sectors outperformed the others. With a strong up day like yesterday, you can see the potential rotation out of sectors like Real Estate, Consumer Staples, and Utilities to the more frothy sectors like Information Technology and Communication Services (mega-cap tech stocks).
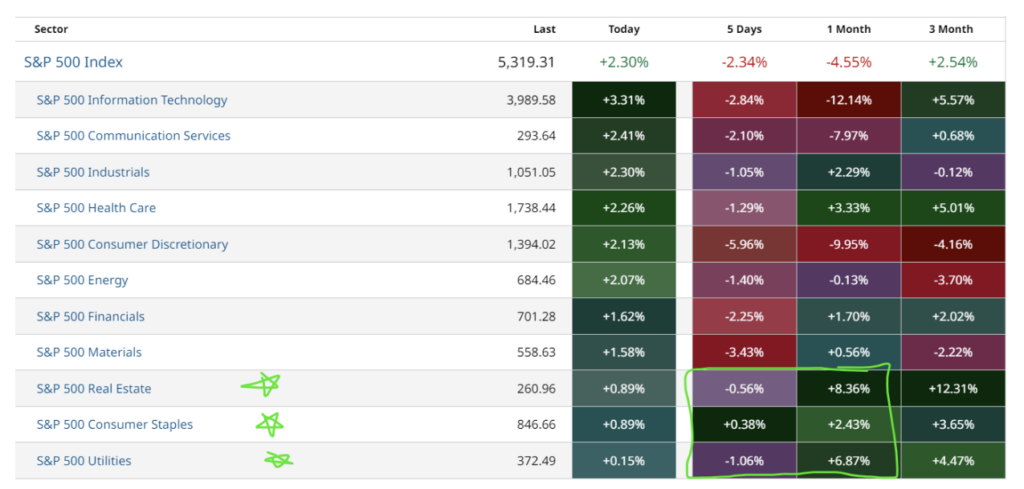
This chart also shows the roller coaster ride we experience. On a strong up-day the tech stocks outperform, but over the last 5-days and even 1-month, the defensive stocks outperform. I’m still cautious, leaning more toward a 75%/25% split between defensive and high-beta stocks.
Next week I’ll talk more about scanning for longs and shorts within sectors – for both high beta and defensive stocks you can trade. Even if you only trade options, you still need to search for the underlying to trade. Until then, have a great weekend!


