
August 18, 2023
IS A REVERSAL IMMINENT?
It was another tumultuous week of trading, with earnings winding down and global economic indicators pushing bond yields higher. Higher bond yields and rising energy prices continued to put pressure on stocks and the market sold off again for most of the week. Market sentiment continues to be down, but there could be some relief in sight. I’ll explain why the market might be flashing an oversold signal right now, even if it’s just for a few days.
Let’s start by reviewing the S&P 500 ETF (SPY), and looking back to the previous drawdown of nearly 10% that occurred in February/March (left side of the chart).
I highlighted two areas.
Area 1 happened around a 4% selloff from the previous peak and the Relative Strength (2 days) and Stochastic (14,3) indicators both showed an oversold market. The SPY reversed selling for about three days and kissed the trend line, before fooling everyone into thinking the selling was over. The selling continued for another 4 – 4.5% before the RSI and Stochastics again showed the market was oversold.
Area #2 shows a time when the RSI and Stochastics were once again oversold right before the market hit its bottom and raced off into the summer.
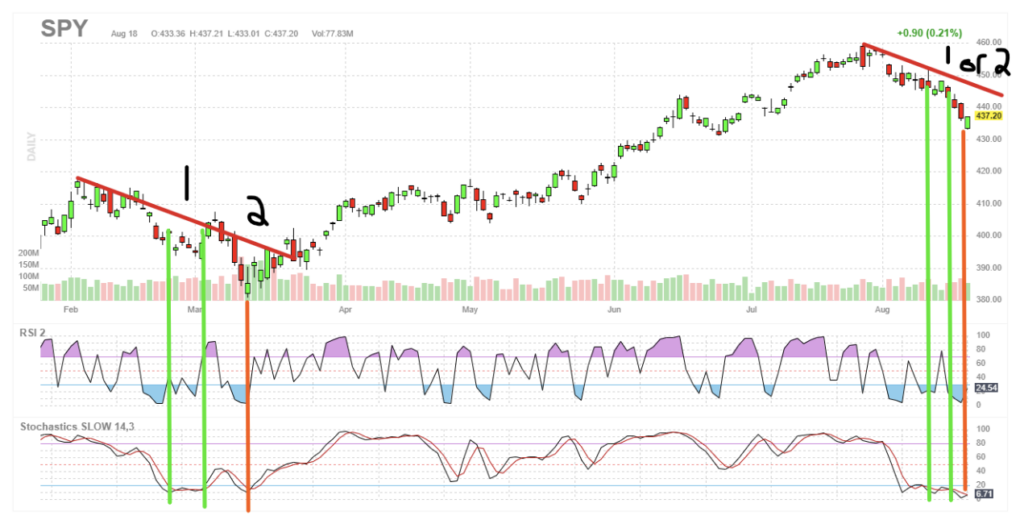
Now, move back over to the right of the chart and you can see something similar is forming. The question is if we are in phase 1 or phase 2.
The market is down over 5% but we haven’t had a fakeout rally, unless you count August 11 and 14th, when RSI and Stochastics were showing an oversold market and the SPY gained over those two days.
Here we are, once again with oversold indicators, so are we headed back up to the trend line before retreating more? Or are we nearing the end of selling?
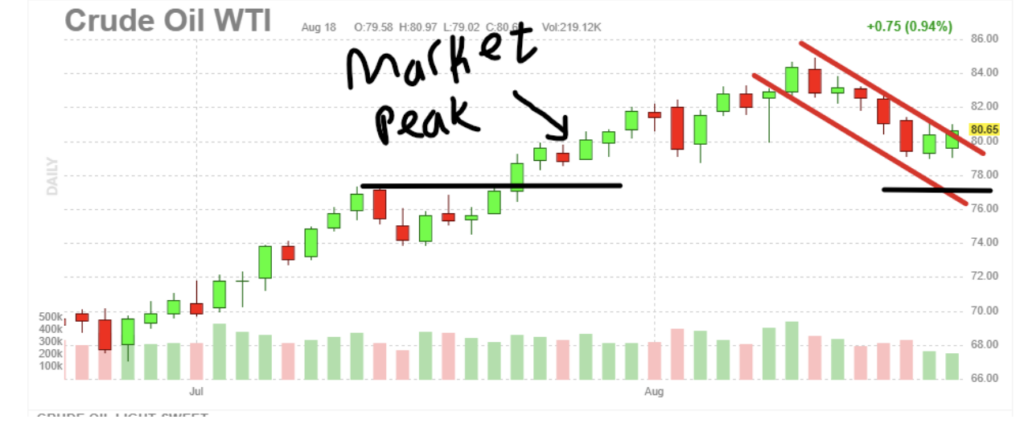
Let’s look at a chart of Crude Oil to see if we can find our answers.
Oil remains stubbornly high, above $77. The market peaked a few short days after Crude Oil crossed over $77. Oil was coming down off its highs, but on Friday it seemed to find support at a level above $77. I don’t expect to see the market rally without oil dropping back below $77.
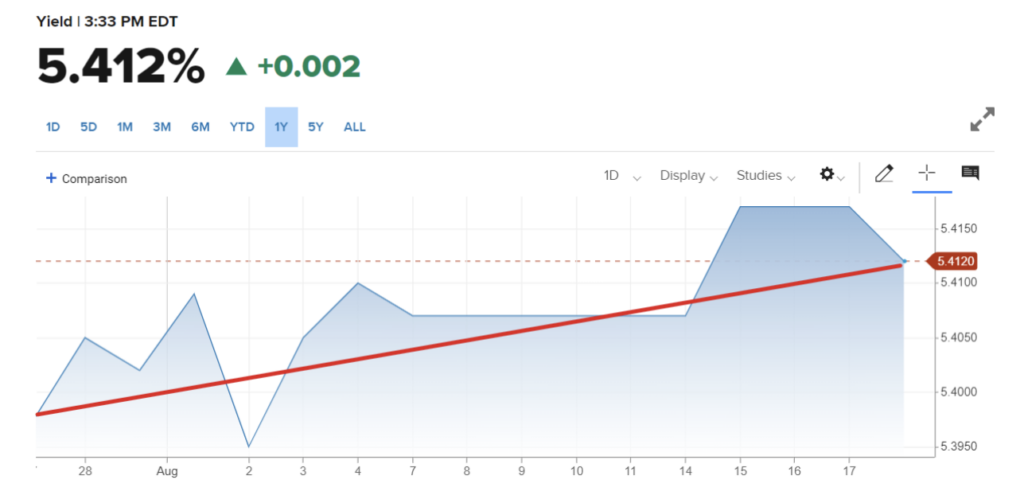
Since the market peaked at the end of July, we’ve also seen the short-term bond yields head higher. Here’s a chart of the 2-month yields heading higher, which has put pressure on the market. We need these to drop for any hope of a rally to have legs.
Rather than embracing any positive economic news, as the market has done all summer, investors now seem to take every piece of news as not good enough, and therefore the market is struggling to find a bottom.
We have a few key areas to watch. We broke through a controlling swing high level and we’re headed in the direction of making a new lower low. If the last few weeks haven’t been a red flag enough, making a new lower low, right around a trend line should give you pause. If that breaks, it’s a long 3.5% down from $430 down to $415 or so on the SPY.
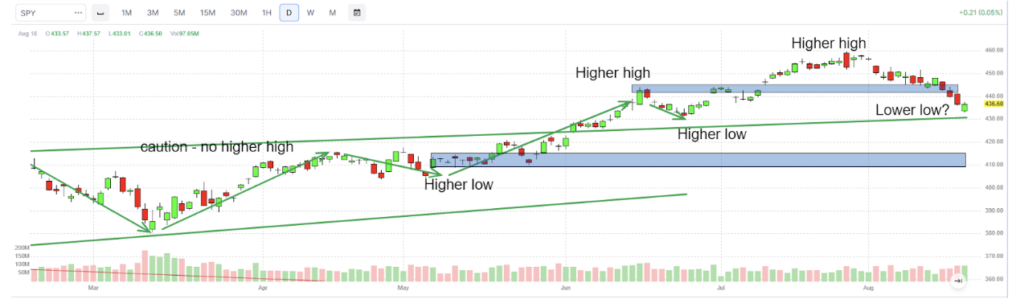
In other words, now is the time for the bulls to jump back in or risk losing control of the bull market back to the bears.
If you have any questions, comments, or anything we can help with, reach us at any time.
Email: [email protected]
Phone: (866) 257-3008
Jeff Wood
Editor, Filthy Rich Dirt Poor
Coach, Options Testing Lab
Any trade or trade idea discussed is for educational purposes only. They will not be tracked as an official trade recommendation.