
With Nvidia representing 7% of the S&P 500, it’s no wonder why investors were held hostage to Nvidia’s earnings report, but now that is beyond us, what can we expect next? Before we get too far, Nvidia’s earnings remind me of years ago when I was trading Apple regularly and the stock got punished for making billions, but not enough billions in profit. Or they sold millions of phones, but not millions + 1. Nvidia’s earnings still show this market has room to go higher, but we’re still on fragile ground.
Despite reporting better-than-expected Q2 earnings, Nvidia sold off more than -6% as it projected Q3 revenue will be about $32.5 billion. While higher than the consensus of $31.9 billion, it failed to top lofty expectations of as high as $37.9 billion. The problem is that these numbers were supposed to reignite the bulls to move the market higher. And that didn’t happen.
Without the bullish Nvidia catalyst, let’s look at the market from a few different angles.
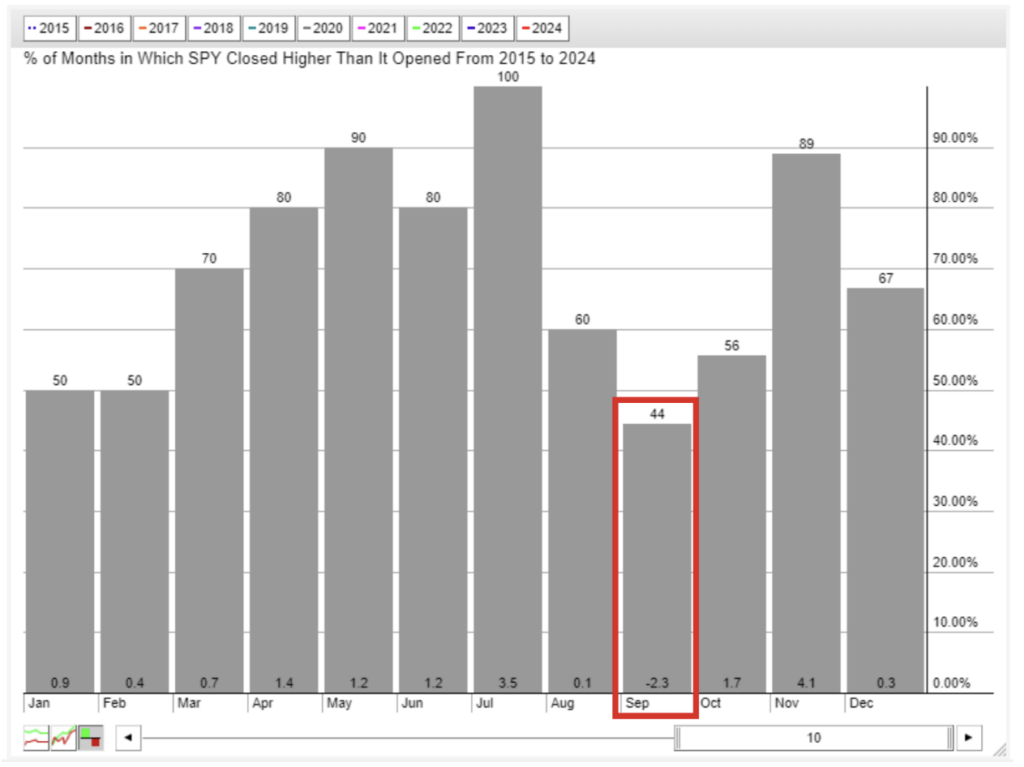
From the seasonality chart below, the S&P 500 (SPY) has only finished positive 44% of the time in September over the last 10 years. The average was a -2.3% return. And we haven’t seen a positive July in over 5 years.
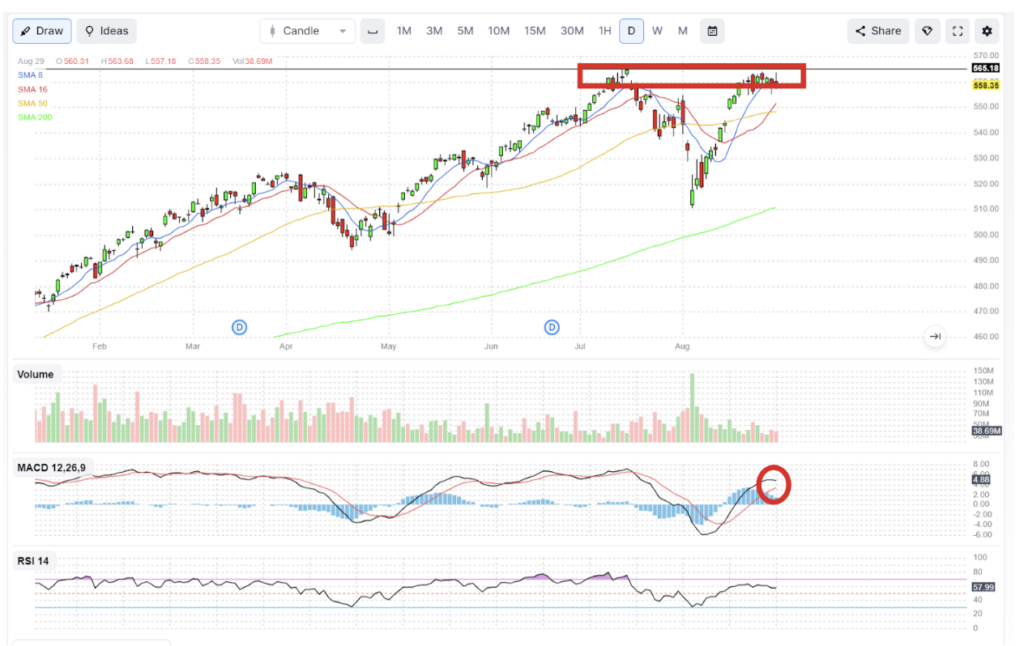
Next, we have a chart of the SPY, showing that the market has been unable to break out to a new higher-high. The MACD is showing a slowing momentum, bullish volume has decreased (but not surprising with the upcoming holiday), and this RSI is hanging on by a thread staying above 50.
Nvidia was supposed to be the news to help the S&P 500, but right now it’s looking like September could see some weakness ahead.
What could change that? Well, the Fed is set to cut interest rates later in the month, but investment banks have been pricing in a cut for weeks now.
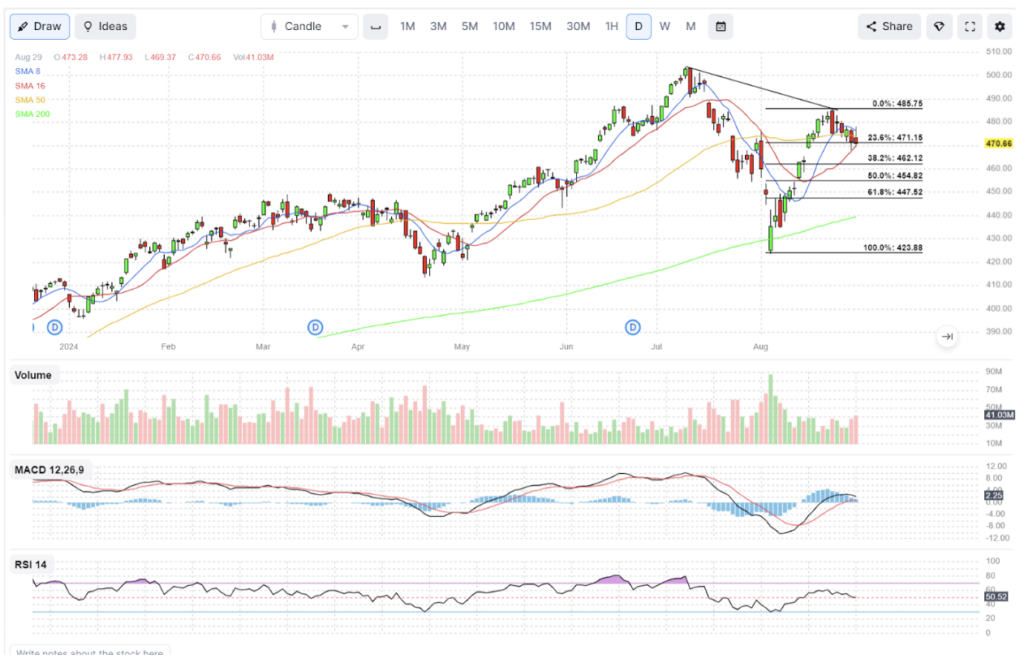
The Technology 100 (QQQ) is also hurting from Nvidia’s drop. The chart below has the next possible support targets. The QQQs showing lower highs and lower lows also support a potential dip in September.
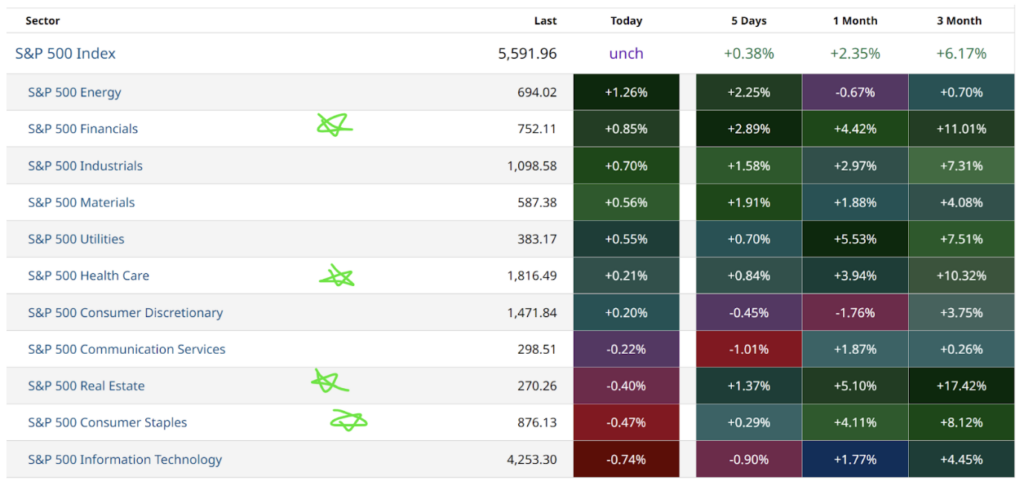
In times like these, you can always look at what has been performing well despite the S&P 500 and Nasdaq 100 showing weakness.
For example, Financials, Health Care, Real Estate, and Consumer Staples are showing strength over multiple time frames based on their performance gains.
Despite September’s reputation as a weak month for stocks and current charts indicating some softness, it’s important to keep in mind that the U.S. Q2 GDP was revised upward due to stronger consumer spending. This suggests that the economy is holding up well, even with high interest rates. Additionally, the Q2 core PCE price index was revised downward. The combination of stronger spending and lower inflation strengthens the argument for a soft landing, which is a positive sign for stocks.
Enjoy your holiday break from the market! Take this time to unwind and recharge for the upcoming trading week. If the market aligns with seasonal trends, it’s a good opportunity to start focusing on strong sectors and planning your next move.