It may be hard to believe, but we’re nearing the end of another quarter in 2024, which means volatility should pick up with the return of earnings season. We’re also nearing a presidential election in the U.S., but first, let’s not forget inflation and the Fed. Before we get too far ahead of ourselves, let’s take a look at a few of the items impacting the market now, and see if we can tell where the market may be heading.
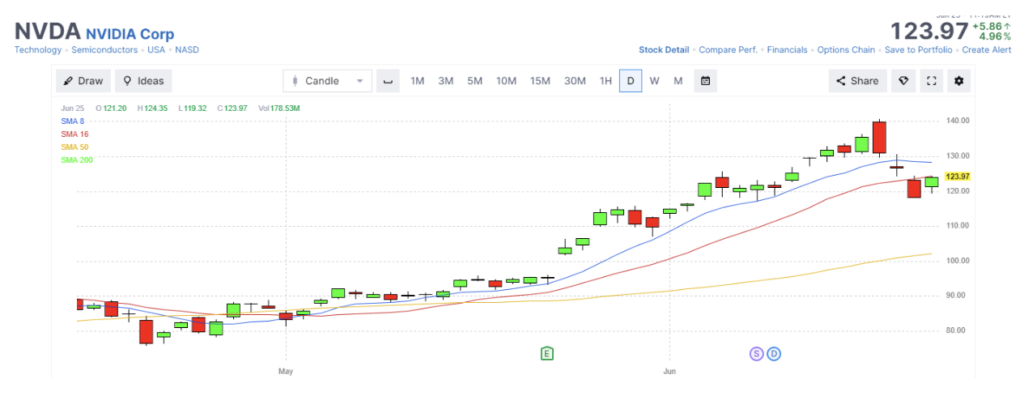
The market is back to having a few mega-caps run the show, while everyone else tries to play catchup. So what happens when one of the few falls apart? Investors felt uneasy earlier in the week when Nvidia (NVDA) sold off quickly, going from around $140 to $120.
The move was significant enough to bring down the technology ETF, QQQ, down with it.
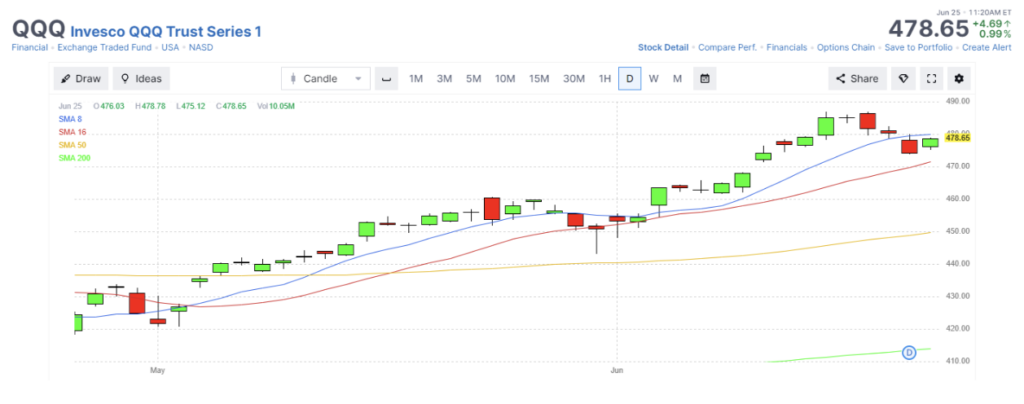
While NVDA fell below its 16-day moving average, QQQ maintained its longer team bullish trend.
Inevitably, investors wonder if this is just a blip or a sign of something bigger to come.
Some of the potential headwinds for stocks are still related to the Fed’s stance on inflation. Fed Governor Bowman pushed bond yields higher (bearish for stocks) when she said she sees several upside risks to the inflation outlook and they are not where they need to be in order to lower the policy rates.
Markets are now discounting the changes for a -25 basis points cut at the July FOMC meeting down to 10%. The chances of a rate cut in September, right before the U.S. presidential election, is now down to 64%. I think it will fall much lower and I have a hard time seeing the Fed doing something right before an election that could be construed as favorable for the incumbent. The data would need to be significantly different so there would be no doubt as to why they cut rates.
That leaves us with the July earnings season as one of the limited bullish catalysts left, assuming companies can find a way to charge less money to consumers (reducing inflation) and still beat earnings expectations. That’s a tall order for stocks, but it can still happen if CEOs report a positive outlook for the future.
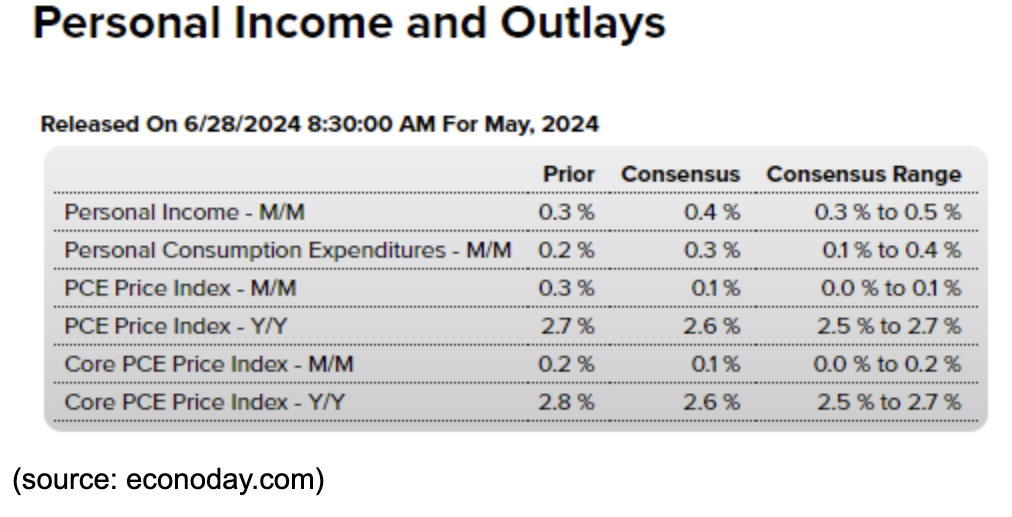
Of course, before we get to July earnings, we have the Fed’s favorite inflation indicator, the PCE report (Personal Consumption and Expenditures) due out this Friday.
The PCE report is expected to show progress in every major category, especially the Core PCE, which excludes food and energy prices. Core PCE is expected to drop year-over-year from 2.8% to 2.6%.
That could be a bullish sign for investors that the inflation and soft landing stories are moving in the right direction. That could be enough to get this bullish train moving again.
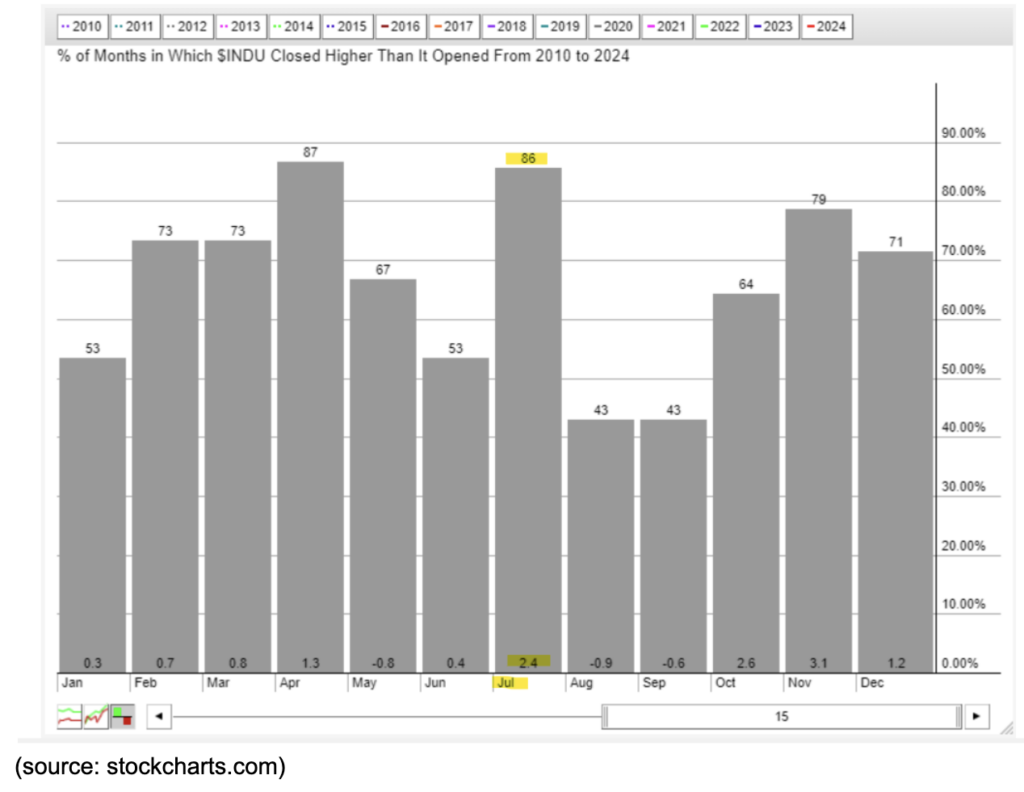
Every year is different, but as we get closer to closing the books on this quarter and look for clues on what will happen next, I’ll leave you with a 15-year seasonality chart of the S&P 500 (SPX). For whatever reason – mostly likely due to strong earnings, the S&P 500 tends to be bullish in July, finishing the month higher 86% of the time with an average monthly gain of 2.4%
With longer-term trend lines intact and a bullish seasonal month ahead, I’d be cautious about the NVDA drop, but so far, the trend is still your friend in the broader market.