Stocks are rallying as investors jump back into technology stocks, again favoring growth over value. Investors quickly forget about the headwinds that spooked them in July and are jumping back into the market. The next leg higher of this rollercoaster ride has started, even though a week ago many investors were ready to sit on the sidelines. What happened this week and how can you find opportunities to take advantage of the movements?
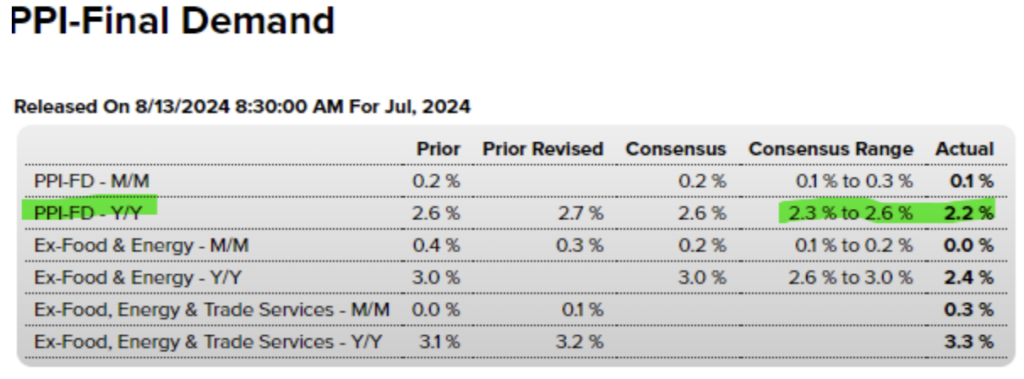
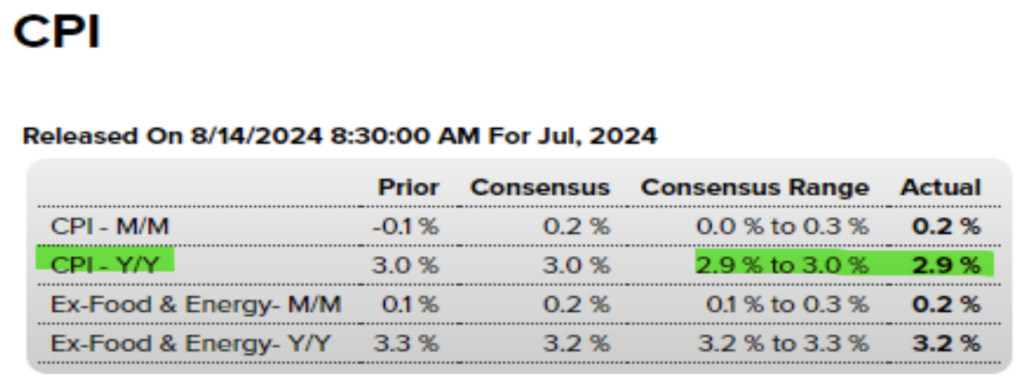
Let’s start with the economic reports this week. The Producer Price Index and Consumer Price Index both came in under the expected number, showing that inflation is returning to normal levels. It’s not disinflation (yes, eggs are still expensive), but we’re not seeing consumer goods prices move as high as fast as we did before.
Producer prices dropped more than expected.
Then Wednesday we saw Consumer prices in line with expectations.
That was good, but then Thursday brought the heat with Jobless Claims and Retail Sales. What’s interesting is that investors got spooked when jobless claims kept creeping higher because that meant the economy was heading for a recession. But if jobless claims were too good, that meant the Fed wouldn’t lower interest rates. Well, after getting spooked, investors welcomed the news that jobless claims came in lower than expected, meaning the economy may not be as bad as people feared a short time ago.

Then Retail Sales smashed it out of the park, showing a month-over-month increase of 1.0%. It was the largest increase in 1.5 years. Even Wal-Mart (WMT) raised its full-year sales guidance.

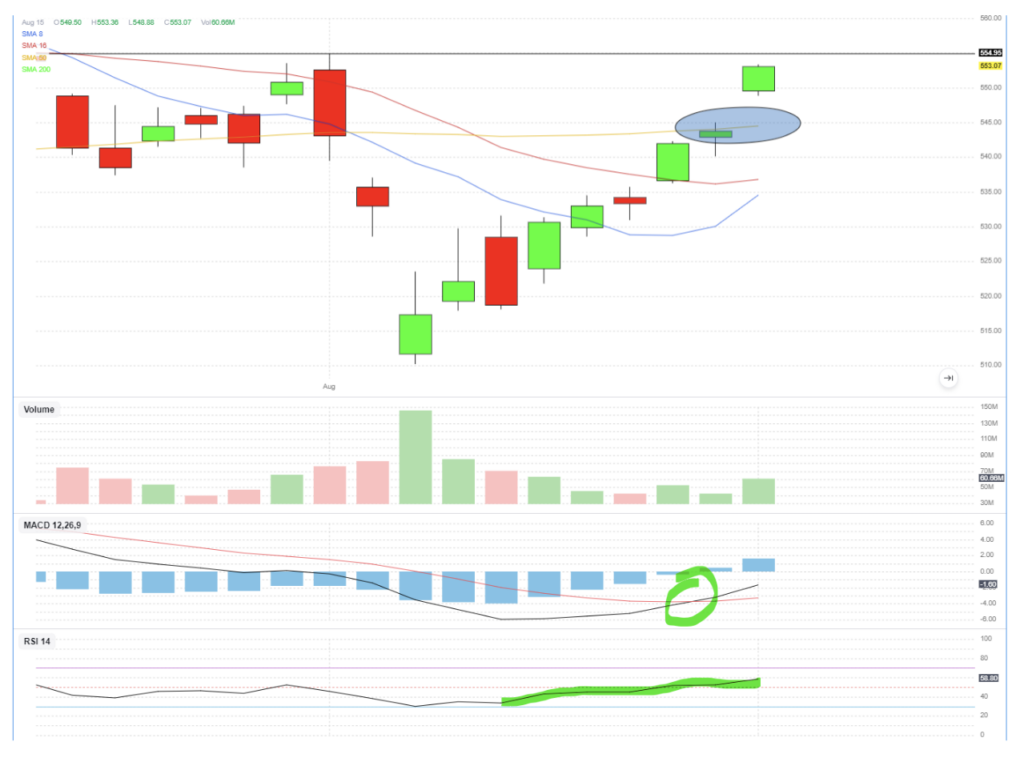
All these things combined have helped turn the S&P 500 around, with the index gapping higher over its 50-day moving average. After shedding off nearly 10% from all-time highs, I said I expected the market was likely to come back and retest the 50-day moving average. And retest it did – by gapping over it.
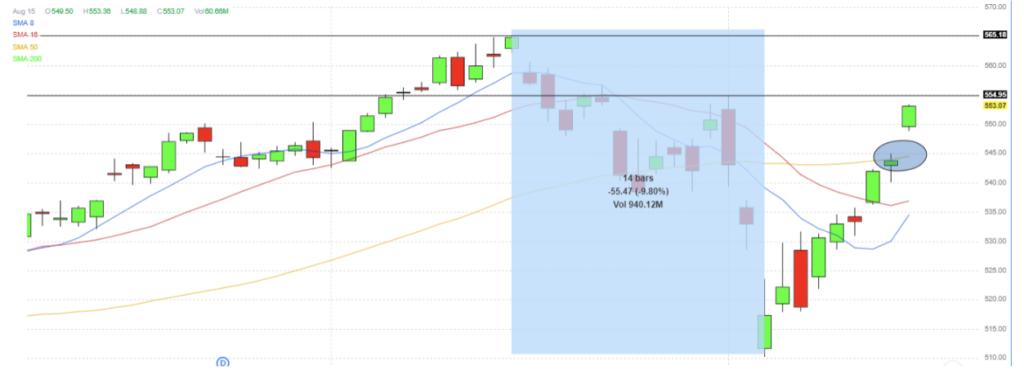
The S&P 500 needs to clear 5550 to make a new swing high. The MACD and RSI are not in overbought conditions, so there’s certainly reason for investors to still feel bullish for the coming days.
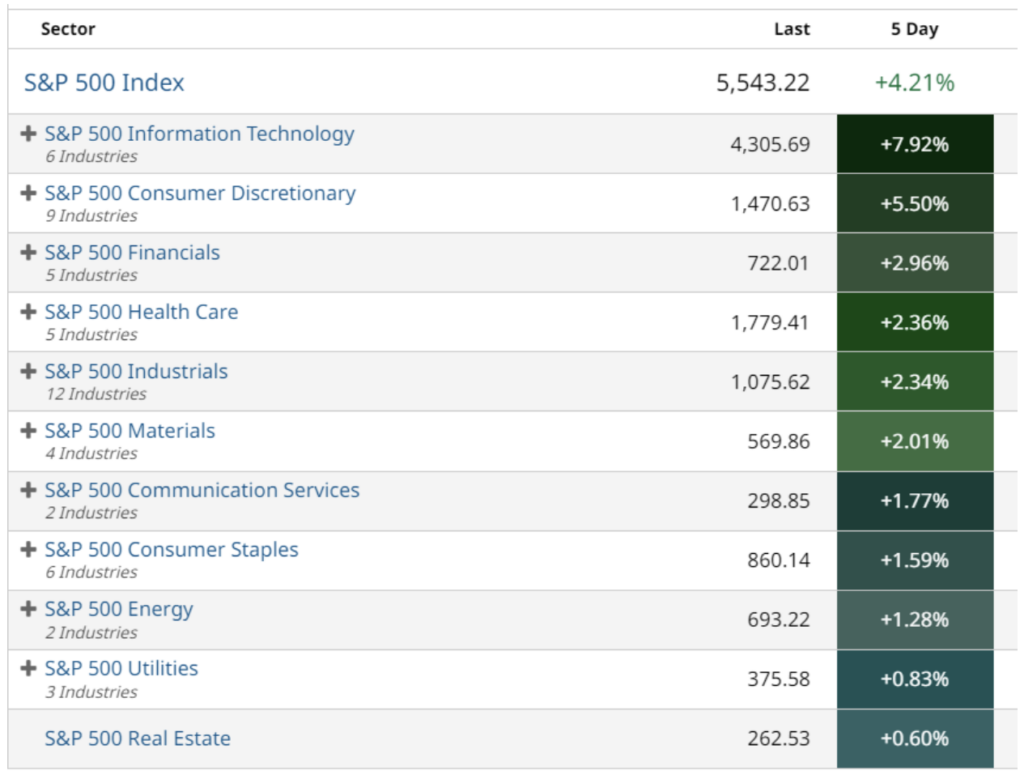
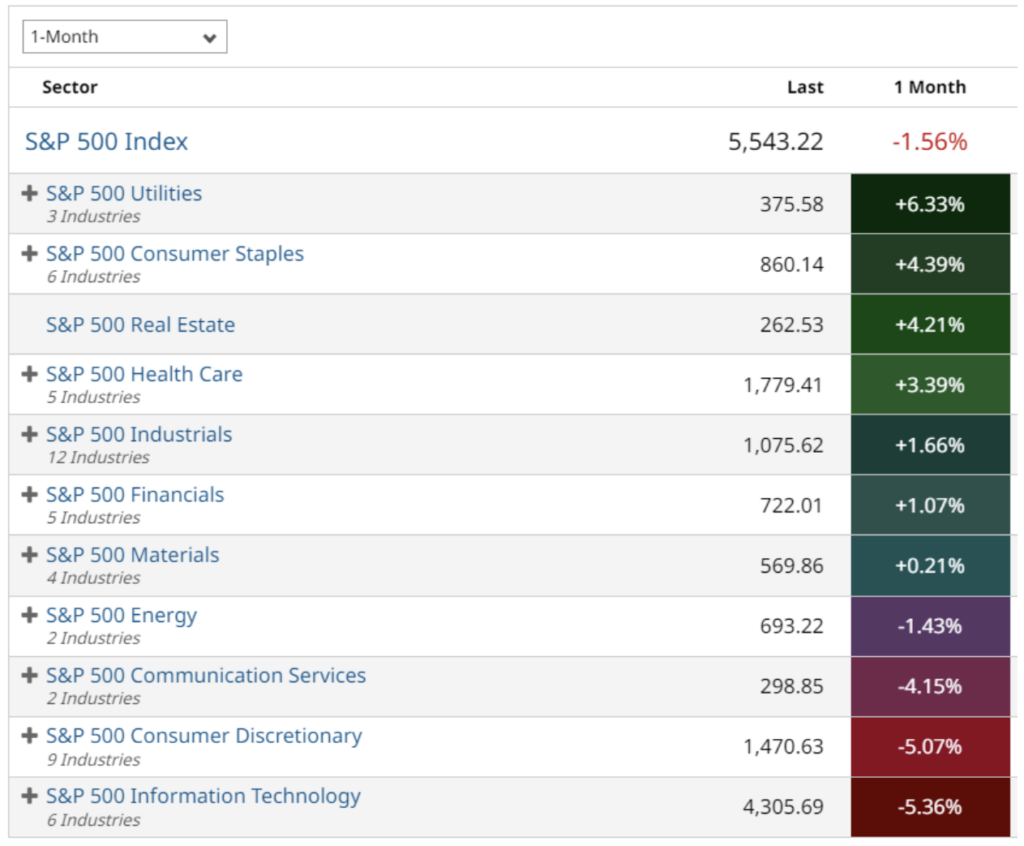
Over the last five trading days, the S&P Information Technology has been rising and went from the worst 1 month ago to the top of the leaderboard.
Here is the performance chart for 5-days.
And here is the chart for 1 month.
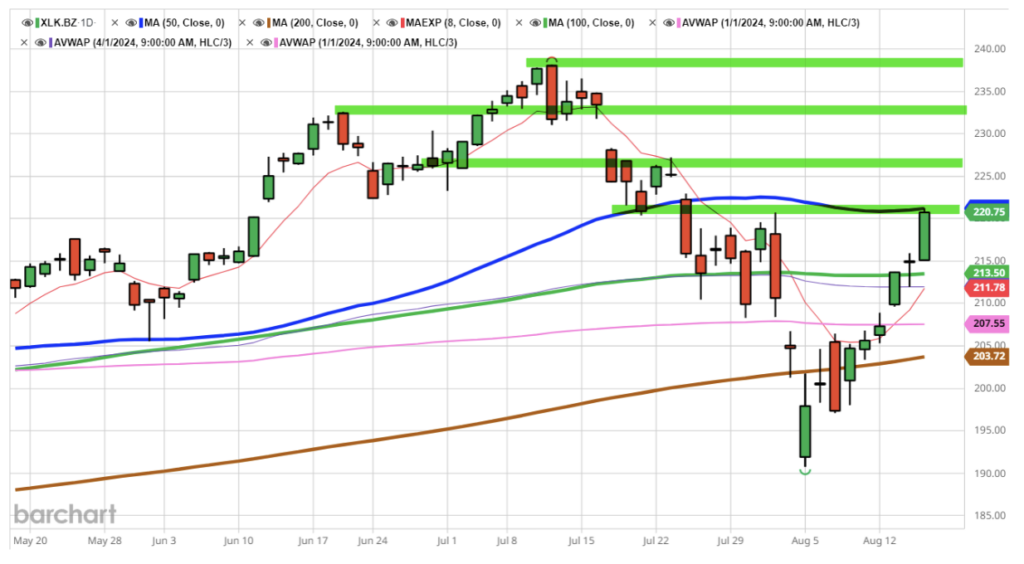
Let’s zero in on Information Technology, but looking at the ETF, XLK. It’s sitting just below its 50-day moving average, around $221. If the bullishness continues, here are the next four possible resistance levels to clear.
As a premium seller, now I can focus my search on one sector and look for the stocks where the implied volatility is greater than historical volatility (we want expensive options to sell) and where the implied volatility percentile is greater than 30%.

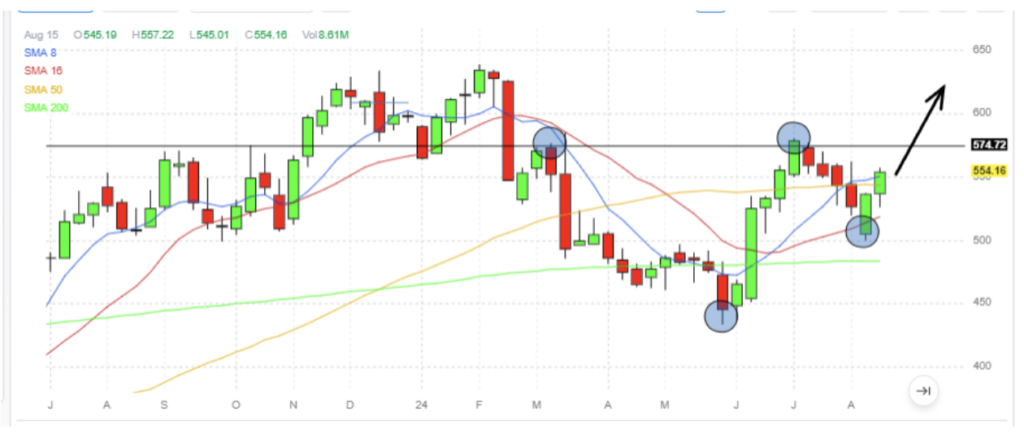
Now, let’s look at Adobe (ADBE)’s weekly chart. The recent swing high technically edged out a new higher high. The most recent swing low is certainly a higher low (blue circles). We’d expect the upward momentum to continue, especially in a strong sector.
Of course, this is for educational purposes only. I don’t know that Information Technology will move higher, but comparing sector performance from 1 month ago to the previous 5 days will give you a picture of what is moving. From there, you need to decide if you want to go for option premium (credit seller) or if you are comfortable with a directional bias enough to be a debit trader, in which case you’d look for options where implied volatility is less than historical volatility because you want to buy options when they are at a historical discount.
Next week we have FOMC meeting minutes and another round of unemployment claims. We shouldn’t have too many surprises from either of those, but this roller coaster ride is far from over.


