The week of Thanksgiving has typically given investors a lot to be thankful for, giving decent returns over the shortened week the majority of the time. By now, most of us have heard of the Santa Clause Rally, so what can history tell us about how the market might perform the rest of the year?
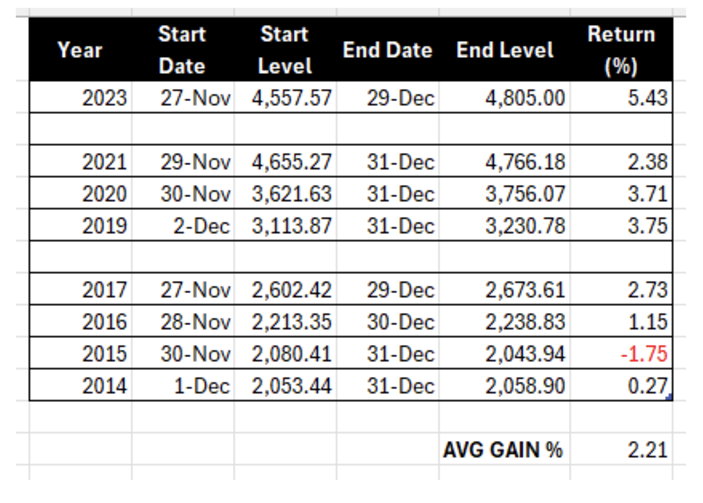
Here’s a chart of the S&P 500 performance over the last 10 years, from the first trading day after Thanksgiving through the last trading day of the year.
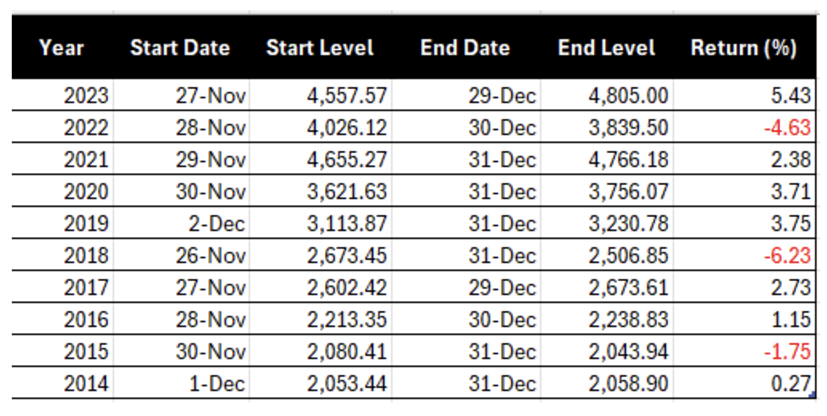
This shows us that 70% of the time the market trades higher, but are we likely to see another 2018 or 2022 this year?
The S&P 500’s decline during the last part of 2018 was driven by several factors:
- Federal Reserve Rate Hikes: The Fed increased interest rates in December 2018, sparking fears of an economic slowdown as higher borrowing costs could dampen growth.
- Trade War with China: Ongoing U.S.-China trade tensions, including new tariffs, increased market uncertainty and weighed on investor confidence.
- Concerns Over Global Growth: Slower growth in key economies like China and Europe added to worries about a potential global economic downturn.
- Government Shutdown: A prolonged U.S. government shutdown, starting in late December, further eroded market sentiment
The S&P 500 started the decline in October of that year so we were already in a downtrend by the time Thanksgiving rolled around.
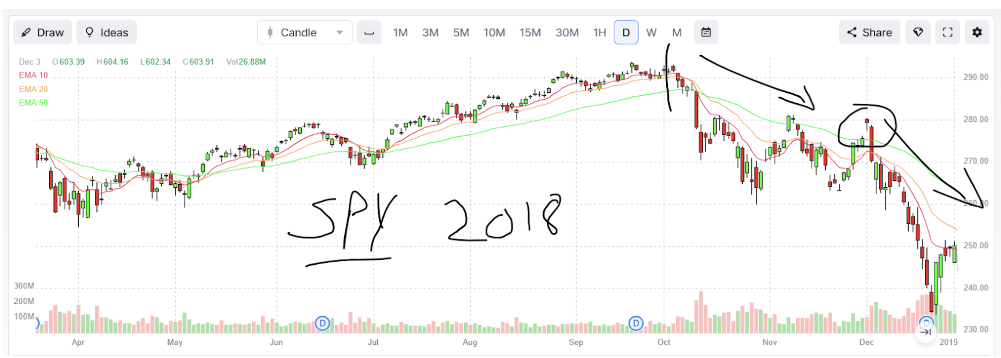
Of those factors, the Trade War with China is the only one that could easily still apply to this year, so what about 2022?
In 2022, the S&P 500 declined after Thanksgiving due to multiple factors:
- Inflation Concerns: Persistent high inflation throughout the year caused investor uncertainty.
- Federal Reserve Rate Hikes: Aggressive rate increases aimed at curbing inflation raised fears of a potential recession.
- Economic Slowdown Fears: Concerns over slowing global growth added to market pressures.
- Tech Sector Weakness: Major selloffs in tech stocks, which are sensitive to interest rate changes, contributed significantly to declines
The S&P 500 was declining for most of the year and the failed break of the longer trend line helped take the wind of the sails for the rest of the year.
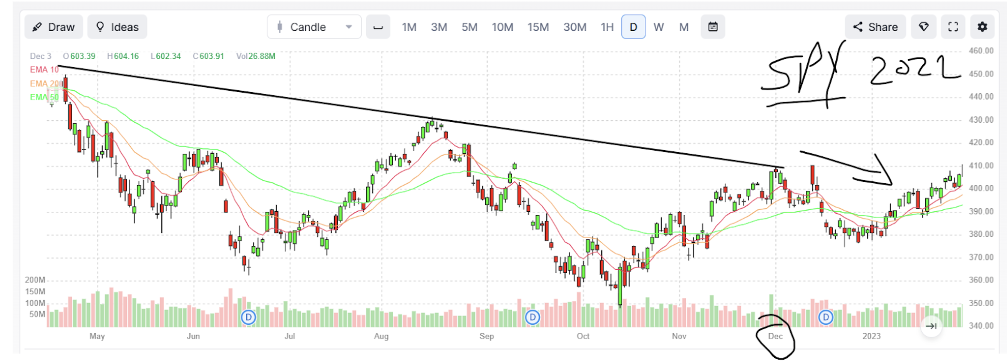
Inflation is still around, but the fear of a recession and global slowdowns have been replaced with AI and hype for a deregulated future. The biggest concern is the Fed and any news stories about potential tariffs and trade wars.
Fast forward to 2022 and the charts look completely different.
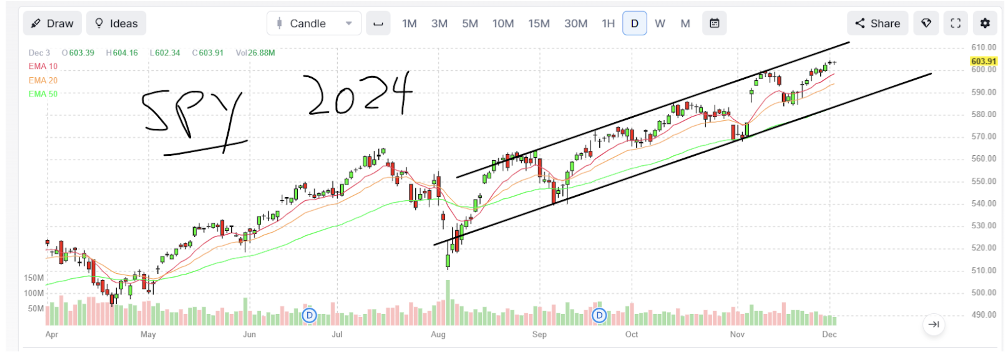
Sure, we’re nearing the top of the long-term trend channel so we could experience a week or two of sluggish movement, but it certainly seems like we’re on pace for a bullish move into the end of the year.
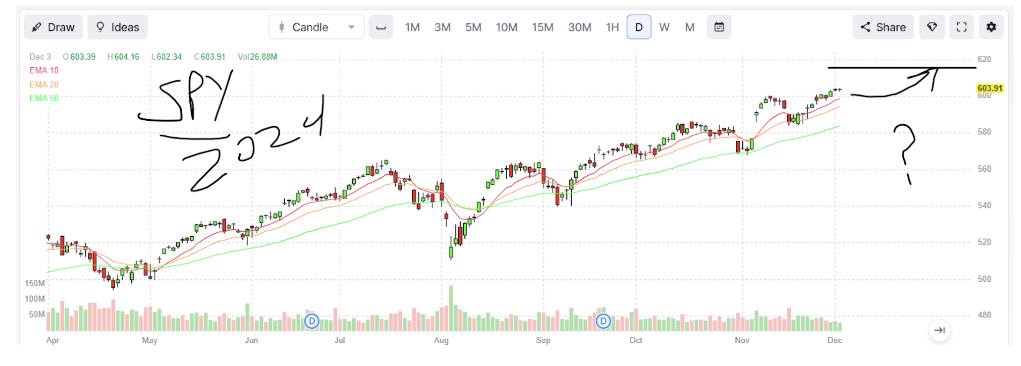
If we go back to the performance chart and remove those two outlier years, the average gain for the S&P 500 after Thanksgiving through the end of the year is just over 2%!
That would put the SPY in the $617 range by the end of the year.
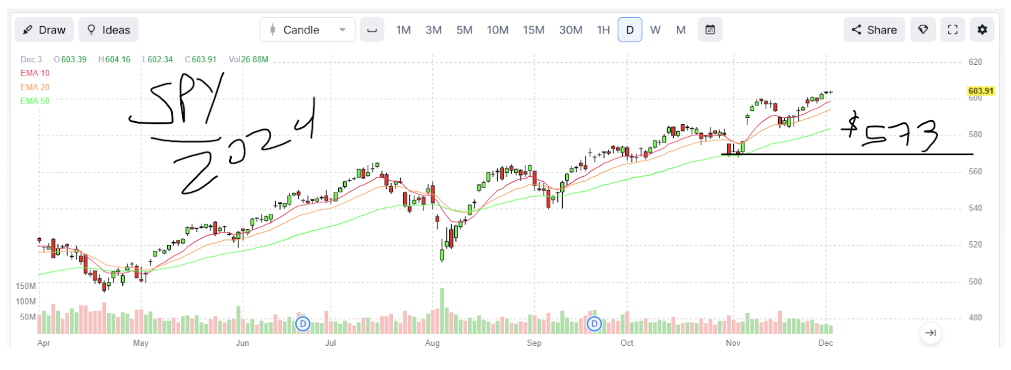
But can we really ignore those bad years? Fine! I will acknowledge them for one last time. Let’s say something does fall apart in the coming days and the market drops like a 2018 or 2022, that would be roughly 5% and that would get the SPY down to around $573. That would be around a key support level that occurred right before the elections, but I’m more apt to believe that we would stop well short of that and pivot off the 50-day moving average (green line). That is only about 3% away from current prices.
What do you think? Are we headed to $617 and beyond or do you think we’re headed lower from here?
I’ll see you back here on Friday!

