Schwab recently released some improvements for their desktop platform, ThinkorSwim. Aside from being able to select a GTC order as your default, one of the other improvements came in the form of a new trend indicator. Sure, the indicator’s name should have gone through some type of user experience group or a focus group. Still, naming aside, I will show you what you need to know and how you can use the new, “PriceTimeFilteringBarCount” indicator.
The “PriceTimeFilteringBarCount” is an indicator in ThinkOrSwim designed to help traders identify the duration of trends by counting the number of consecutive bars that meet specific criteria. This indicator can be particularly useful for assessing trend strength and potential reversals.
Here’s a brief overview of how it works and a related strategy:
Overview of PriceTimeFilteringBarCount
- Definition: It counts the number of consecutive bars that either close higher or lower than the previous bar.
- Parameters: The indicator typically includes parameters like aggregation period, which defines the time frame for the analysis, and thresholds for defining what constitutes an uptrend or downtrend.
- Application: It is used in conjunction with other indicators, such as the PriceTimeFilteringAccVolume, to provide a comprehensive view of market trends by combining price movement and volume data.
- Uptrend: If the close price of the most recent period is greater than the high price of the previous period.
- Downtrend: If the close price of the most recent period is less than the low price of the previous period.
- Trend: Maintains direction until changed by one of the above rules.
- Histogram: Positive histogram bars represent uptrends and negative bars represent downtrends. The size of each histogram bar increases sequentially as long as a trend persists.
Trading Strategy Using PriceTimeFilteringBarCount
Strategy: Trend Following with Confirmation
- Setup:
- Apply the PriceTimeFilteringBarCount indicator to your chart.
- Use a secondary indicator like Moving Average or MACD for additional trend confirmation.
- Entry Rules:
- Bullish Entry: Enter a long position when the PriceTimeFilteringBarCount shows a series of consecutive bullish bars (e.g., 5 or more) and the secondary indicator confirms an uptrend.
- Bearish Entry: Enter a short position when the PriceTimeFilteringBarCount shows a series of consecutive bearish bars (e.g., 5 or more) and the secondary indicator confirms a downtrend.
- Exit Rules:
- Trailing Stop: Use a trailing stop to lock in profits as the trend progresses.
- Reversal Signal: Exit the position if the PriceTimeFilteringBarCount reverses (e.g., if a series of bearish bars appears after a bullish trend).
- Risk Management:
- Set stop-loss orders just below the recent low for long positions and above the recent high for short positions.
- Use position sizing to manage risk according to your overall trading strategy and risk tolerance.
By integrating the PriceTimeFilteringBarCount with other technical indicators, you can enhance your ability to identify and follow sustained trends in the market. This approach helps in capturing significant price movements while managing risk effectively.
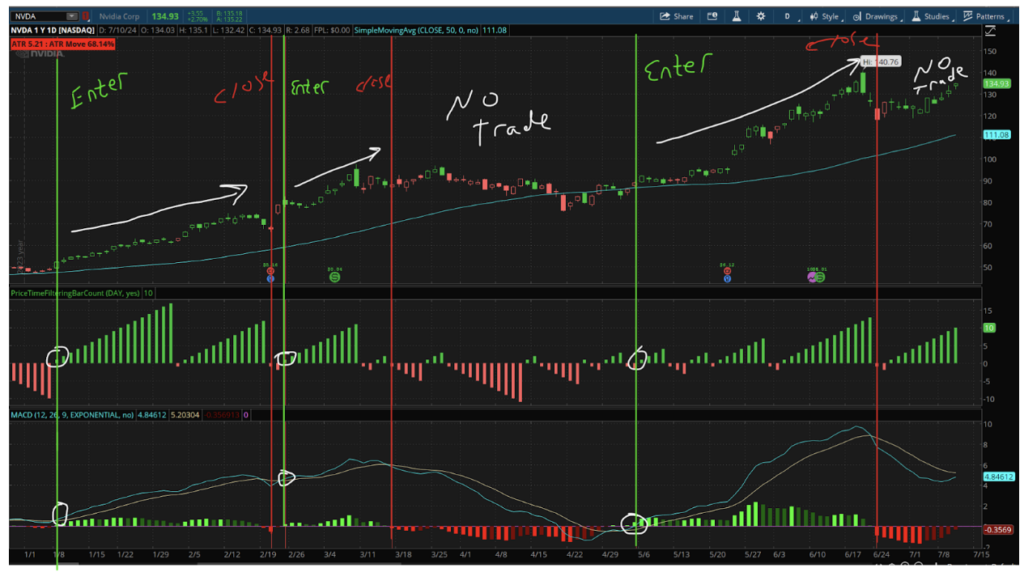
Let’s look at an example. Here’s a chart of Nvidia (NVDA) with a 50-day simple moving average and a MACD with default settings.
A potential bullish entry would be when the PriceTimeFilteringBarCount > 0, the MACD is > MACD Signal Line, and the close is > the 50-day simple moving average.
To exit, in the example below, I highlighted the moments when the count switched from positive to negative and the MACD had a bearish crossover. That’s two out of the three indicators that moved against you since the opening of the position. Looking at the chart, you may have chosen to ignore an exit as long as the stock stayed above its 50-day moving average, but at the very least it indicated to tighten up your stops.
The strategy I mentioned hasn’t been thoroughly tested on multiple markets and timeframes, but feel free to do some testing with the new indicator. It can highlight some good potential entries and help you to identify bullish and bearish trends.
You can also use the indicator on a daily chart, but select weekly aggregation for the indicator and you get a form of multi-time frame analysis on a single chart.
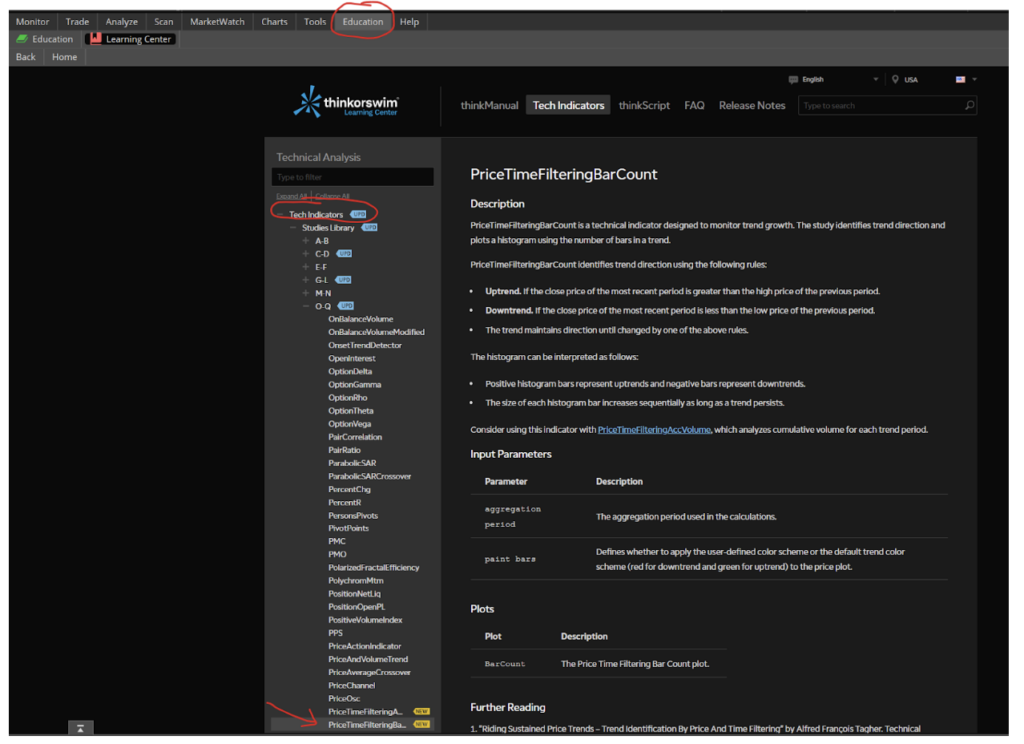
If you want more information on the indicator, you can go to the Education tab within ThinkorSwim, select Tech Indicators on the left side, and find the indicator by name.